
 資料結構
資料結構 網路
網路 RDBMS
RDBMS 作業系統
作業系統 Java
Java iOS
iOS HTML
HTML CSS
CSS Android
 Python
 C 程式語言
 C++
C++ C#
C# MongoDB
 MySQL
MySQL Javascript
 PHP
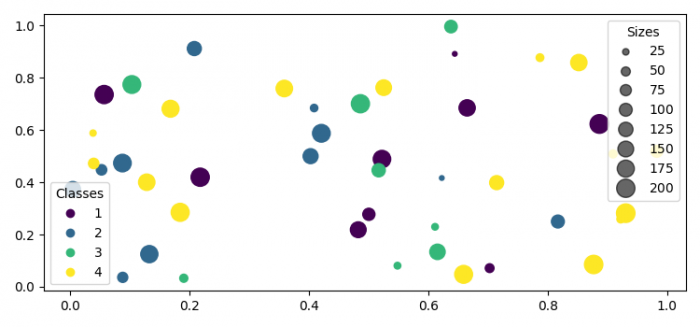
PHPMatplotlib 中自動建立圖例
為了在 Matplotlib 中自動建立圖例,我們可以採取以下步驟:
- 設定圖形大小並調整子圖之間的填充。
- 初始化一個變數 N,用於表示樣本資料的數量。
- 使用 numpy 建立 x、y、c 和 s 資料。
- 使用 subplots() 方法建立一個圖形和一組子圖。
- 使用不同的顏色和大小繪製 x 和 y 資料點。
- 在軸上放置一個圖例。
- 向圖形中新增一個 artist。
- 為 PathCollection 建立圖例控制代碼和標籤。
- 再次為大小在軸上放置一個圖例。
- 使用 show() 方法顯示圖形。
示例
import matplotlib.pyplot as plt
import numpy as np

plt.rcParams["figure.figsize"] = [7.50, 3.50]
plt.rcParams["figure.autolayout"] = True

N = 45
x, y = np.random.rand(2, N)
c = np.random.randint(1, 5, size=N)
s = np.random.randint(10, 220, size=N)
fig, ax = plt.subplots()
scatter = ax.scatter(x, y, c=c, s=s)
legend1 = ax.legend(*scatter.legend_elements(), loc="lower left", title="Classes")
ax.add_artist(legend1)
handles, labels = scatter.legend_elements(prop="sizes", alpha=0.6)
legend2 = ax.legend(handles, labels, loc="upper right", title="Sizes")

plt.show()
輸出

更新於:10-Jun-2021
788 檢視次數

廣告