
 資料結構
資料結構 網路
網路 RDBMS
RDBMS 作業系統
作業系統 Java
Java iOS
iOS HTML
HTML CSS
CSS Android
 Python
 C 語言程式設計
 C++
C++ C#
C# MongoDB
 MySQL
MySQL Javascript
 PHP
PHP如何在 Matplotlib 中僅在繪圖圖例中顯示文字標籤?
要在繪圖圖例中僅顯示文字標籤,可以在 legend 方法的引數中使用 handlelength=0、handletextpad=0 和 fancybox=0。
步驟
設定圖形大小並調整子圖之間的和周圍的邊距。
使用 numpy 建立隨機的 x 和 y 資料點。
使用 subplots() 方法建立一個圖形和一組子圖。
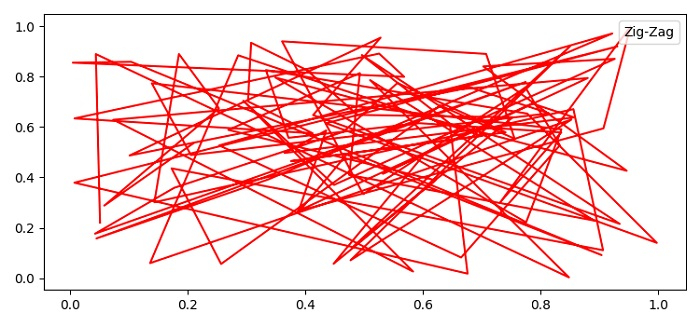
使用 plot() 方法繪製 x 和 y 資料點,並使用“鋸齒形”作為圖例的標籤。
使用 legend() 方法將繪圖標籤放置在圖中,並在其引數中使用 handlelength=0、handletextpad=0 和 fancybox=0。
要顯示該圖形,請使用 show() 方法。
示例
import numpy as np
from matplotlib import pyplot as plt
plt.rcParams["figure.figsize"] = [7.50, 3.50]
plt.rcParams["figure.autolayout"] = True
x = np.random.rand(100)
y = np.random.rand(100)
fig, ax = plt.subplots()
ax.plot(x, y, label='Zig-Zag', c="red")
ax.legend(loc="upper right", handlelength=0, handletextpad=0, fancybox=True)
plt.show()
輸出

更新時間: 2021 年 6 月 1 日
1K+ 瀏覽量

廣告