
 資料結構
資料結構 網路
網路 RDBMS
RDBMS 作業系統
作業系統 Java
Java iOS
iOS HTML
HTML CSS
CSS Android
 Python
 C 程式設計
 C++
C++ C#
C# MongoDB
 MySQL
MySQL JavaScript
 PHP
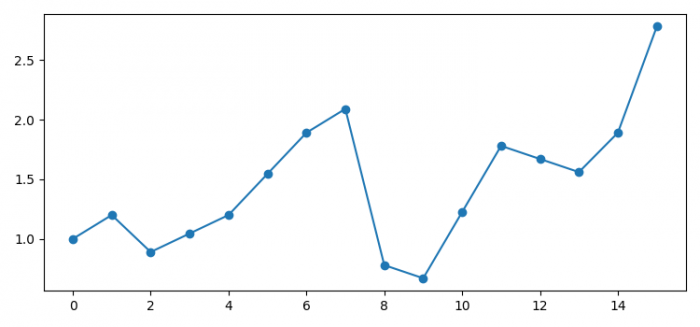
PHP在不使用填充或內插的情況下從 DataFrame 中刪除 NaN 值(Python Matplotlib)
若要從 DataFrame 中刪除 NaN 值,無需過濾或內插,我們可以按以下步驟操作 -
步驟
設定圖形尺寸並調整子圖之間和周圍的填充。
建立一個用於建立 Pandas 資料幀的陣列。
一維 ndarray,帶有軸標籤(包括時間序列)。
繪製插值,“索引”、“值” - 使用索引的實際數值。
使用 show() 方法顯示圖形。
例項
import numpy as np
import pandas as pd
from matplotlib import pyplot as plt

# Set the figure size
plt.rcParams["figure.figsize"] = [7.50, 3.50]
plt.rcParams["figure.autolayout"] = True

# Numpy array
data = np.array([1., 1.2, 0.89, np.NAN,
   1.2, np.NAN, 1.89, 2.09,
   .78, .67, np.NAN, 1.78,
   np.NAN, 1.56, 1.89, 2.78]
   )

# Pandas dataframe
df = pd.Series(data)

# Plot the interpolation
df.interpolate('index').plot(marker='o')

# Display the plot
plt.show()
輸出
將產生以下輸出 -

更新日期:01-Feb-2022
千次以上瀏覽量

廣告