- PySimpleGUI 教程
- PySimpleGUI - 主頁
- PySimpleGUI - 介紹
- PySimpleGUI - 環境設定
- PySimpleGUI - Hello World
- PySimpleGUI - 彈出視窗
- PySimpleGUI - 視窗類
- PySimpleGUI - 元素類
- PySimpleGUI - 事件
- PySimpleGUI - 選單欄
- PySimpleGUI - Matplotlib 整合
- PySimpleGUI - PIL 使用方法
- PySimpleGUI - 偵錯程式
- PySimpleGUI - 設定
- PySimpleGUI 有用資源
- PySimpleGUI - 快速指南
- PySimpleGUI - 有用資源
- PySimpleGUI - 討論
PySimpleGUI - 圖形元素
圖形元素類似於畫布,但功能非常強大。你可以定義自己的座標系,使用你自己的單位,然後再將它們顯示在以畫素定義的區域中。
你應該向圖形物件提供以下值:
畫布大小(以畫素為單位)
座標系左下角 (x,y) 座標
座標系右上角 (x,y) 座標
建立圖形元素,可以透過呼叫與 Tkinter 畫布類似的下列方法獲取圖形 ID:
draw_arc(self, top_left, bottom_right, extent, start_angle, style=None, arc_color='black', line_width=1, fill_color=None)
draw_circle(self, center_location, radius, fill_color=None, line_color='black', line_width=1)
draw_image(self, filename=None, data=None,  location=(None, None))
draw_line(self, point_from, point_to, color='black', width=1)
draw_lines(self, points, color='black', width=1)
draw_oval(self, top_left, bottom_right, fill_color=None, line_color=None, line_width=1)
draw_point(self, point, size=2, color='black')
draw_polygon(self, points, fill_color=None, line_color=None, line_width=None)
draw_rectangle(self, top_left, bottom_right, fill_color=None, line_color=None, line_width=None)
draw_text(self, text, location, color='black', font=None, angle=0, text_location='center')
除了上述繪製方法之外,圖形類還定義 move_figure() 方法,透過該方法可以根據相對於其前一個座標的新座標將由其 ID 標識的影像移動到新位置。
move_figure(self, figure, x_direction, y_direction)
如果你將 drag_submits 屬性設定為 True,那麼可以捕捉圖形區域內的滑鼠事件。當你單擊圖形區域中的任意位置時,將生成以下事件:Graph_key + '+UP'。
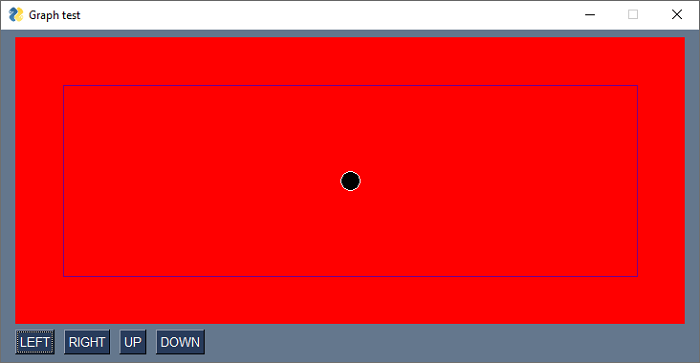
在以下示例中,我們在圖形元素的中心處畫一個小圓圈。圖形物件下方有用於在左、右、上、下方向移動圓圈的按鈕。單擊時,將呼叫 mov_figure() 方法。
import PySimpleGUI as psg
graph=psg.Graph(canvas_size=(700,300), graph_bottom_left=(0, 0), graph_top_right=(700,300),
 background_color='red', enable_events=True, drag_submits=True, key='graph')
layout = [[graph], [psg.Button('LEFT'), psg.Button('RIGHT'), psg.Button('UP'), psg.Button('DOWN')]]
window = psg.Window('Graph test', layout, finalize=True)
x1,y1 = 350,150
circle = graph.draw_circle((x1,y1), 10, fill_color='black', line_color='white')
rectangle = graph.draw_rectangle((50,50), (650,250), line_color='purple')
while True:
   event, values = window.read()
   if event == psg.WIN_CLOSED:
      break
   if event == 'RIGHT':
      graph.MoveFigure(circle, 10, 0)
   if event == 'LEFT':
      graph.MoveFigure(circle, -10,0)
   if event == 'UP':
      graph.MoveFigure(circle, 0, 10)
   if event == 'DOWN':
      graph.MoveFigure(circle, 0,-10)
   if event=="graph+UP":
      x2,y2= values['graph']
      graph.MoveFigure(circle, x2-x1, y2-y1)
      x1,y1=x2,y2
window.close()
執行上述程式。使用按鈕移動圓圈。
pysimplegui_element_class.htm
廣告