
 資料結構
資料結構 網路
網路 RDBMS
RDBMS 作業系統
作業系統 Java
Java iOS
iOS HTML
HTML CSS
CSS Android
 Python
 C 程式設計
 C++
C++ C#
C# MongoDB
 MySQL
MySQL Javascript
 PHP
PHP如何設定 matplotlib 中區域性 rcParams 或某個圖形的 rcParams?
要設定 matplotlib 中區域性 rcParams 或某個圖形的 rcParams,我們可以按如下步驟進行 -
步驟
設定圖大小並調整子圖之間及周圍的填充。
初始化變數 N 來儲存樣本資料的數量。
使用 numpy 建立 x 和 y 資料點。
返回一個上下文管理器,用於臨時更改 rcParams。
在當前圖形中新增子圖,位於索引 1 處。
使用 plot() 方法繪製 x 和 y 資料點。
在當前圖形中新增子圖,位於索引 2 處。
使用 plot() 方法繪製 x 和 y 資料點。
要顯示圖形,使用 show() 方法。
示例
import pandas as pd
import numpy as np
from matplotlib import pyplot as plt
plt.rcParams["figure.figsize"] = [7.50, 3.50]
plt.rcParams["figure.autolayout"] = True
N = 10
x = np.random.rand(N)
y = np.random.rand(N)
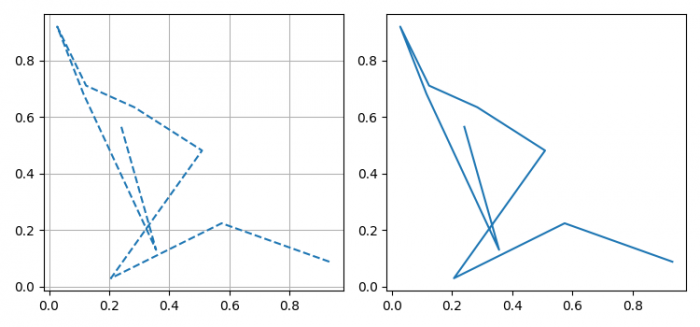
with plt.rc_context({"axes.grid": True, "grid.linewidth": 0.75, "lines.linestyle": 'dashed'}):
plt.subplot(121)
plt.plot(x, y)
plt.subplot(122)
plt.plot(x, y)
plt.show()輸出
將產生以下輸出 -

更新時間: 2022 年 2 月 1 日
2K+ 瀏覽量

廣告