
 資料結構
資料結構 網路
網路 RDBMS
RDBMS 作業系統
作業系統 Java
Java iOS
iOS HTML
HTML CSS
CSS Android
 Python
 C 程式設計
 C++
C++ C#
C# MongoDB
 MySQL
MySQL Javascript
 PHP
PHP如何在 matplotlib 中為日期設定 xticklabels?
要為 matplotlib 中的日期設定 xticklabels,我們可以採取以下步驟 -
步驟
設定圖形大小並調整子圖之間和周圍的間距。
建立兩個 epochs 和 values 的列表。
從 epochs 獲得日期列表。
建立一個圖形和一組子圖。
使用 plot() 方法繪製日期和值。
設定 xticklabels、獲取日期格式化程式並設定主要格式化程式。
要刪除刻度標籤的重疊,將它旋轉 10 度。
要顯示圖形,使用 show() 方法。
示例
import matplotlib.pyplot as plt
import matplotlib.dates as mdates
import time
plt.rcParams["figure.figsize"] = [7.50, 3.50]
plt.rcParams["figure.autolayout"] = True
epochs = [1259969793926, 1259969793927, 1259969793929, 1259969793928, 1259969793939]
values = [-0.5, -0.5, -0.75, -0.5, -1.25]
dates = [time.strftime('%Y-%m-%d %H:%M:%S', time.localtime(date)) for date in epochs]
fig, axes = plt.subplots(1, 1)
line1, = axes.plot(dates, values, lw=2, marker='*', color='r')
axes.set_xticklabels(dates)
fmt = mdates.DateFormatter('%Y-%m-%d %H:%M:%S')
axes.xaxis.set_major_formatter(fmt)
axes.tick_params(rotation=10)
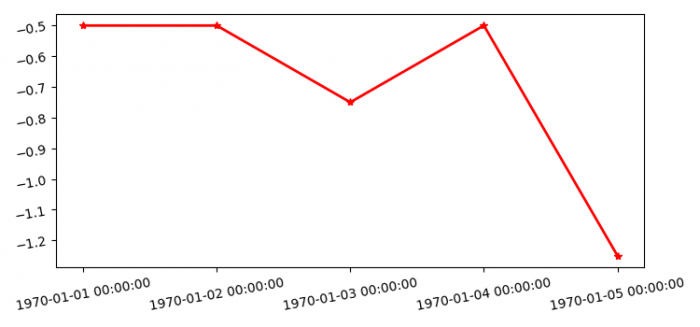
plt.show()輸出
它將產生以下輸出 -

更新於: 02-Feb-2022
3K+ 瀏覽量

廣告