
 資料結構
資料結構 網路
網路 RDBMS
RDBMS 作業系統
作業系統 Java
Java iOS
iOS HTML
HTML CSS
CSS Android
 Python
 C 程式設計
 C++
C++ C#
C# MongoDB
 MySQL
MySQL JavaScript
 PHP
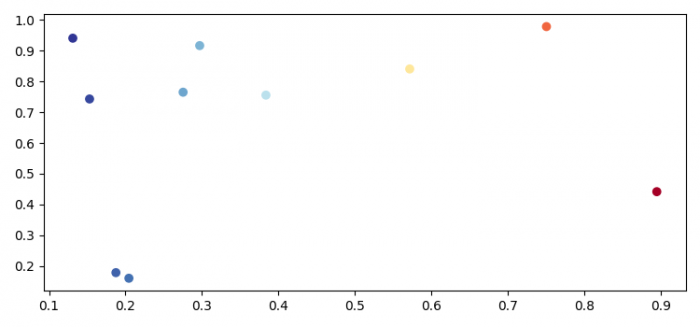
PHP如何用 Matplotlib 繪製複數(複數平面)?
要使用 matplotlib 繪製複數,我們可以建立一個包含複數的資料集。
步驟
- 設定圖形大小並調整子圖之間和周圍的填充。
- 建立隨機複數。
- 使用 subplots() 方法建立一個圖形和一組子圖。
- 使用 scatter() 方法繪製散點。
- 要顯示圖形,請使用 **show()** 方法。
示例
import numpy as np
from matplotlib import pyplot as plt
plt.rcParams["figure.figsize"] = [7.50, 3.50]
plt.rcParams["figure.autolayout"] = True
data = np.random.rand(10) + 1j*np.random.rand(10)
fig, ax = plt.subplots()
ax.scatter(data.real, data.imag, c=data.real, cmap="RdYlBu_r")
plt.show()
輸出

更新於: 2021 年 6 月 1 日
461 次瀏覽

廣告