
 資料結構
資料結構 網路
網路 關係資料庫管理系統(RDBMS)
 作業系統
作業系統 Java
Java iOS
iOS HTML
HTML CSS
CSS Android
 Python
 C語言程式設計
 C++
C++ C#
C# MongoDB
 MySQL
MySQL Javascript
 PHP
PHP如何在MATLAB中繪製二元函式?
MATLAB 提供各種內建函式,藉助不同型別的繪圖(如網格圖、曲面圖、散點圖等)來繪製二元函式。在本教程中,我將解釋在 MATLAB 中繪製二元函式的過程。
在MATLAB中繪製二元函式
下面解釋了在 MATLAB 中繪製二元函式的分步過程。
步驟 (1) - 定義 x 和 y 點的範圍。
步驟 (2) - 建立 x 和 y 點的網格。為此,請在 MATLAB 中使用“meshgrid”函式。
語法
[X, Y] = meshgrid(x, y);
步驟 (3) - 定義需要繪製的二元函式。
步驟 (4) - 建立函式的繪圖。
因此,在 MATLAB 中繪製二元函式是一個簡單的四步過程。
讓我們藉助 MATLAB 示例來了解上述演算法。
使用網格圖繪製二元函式
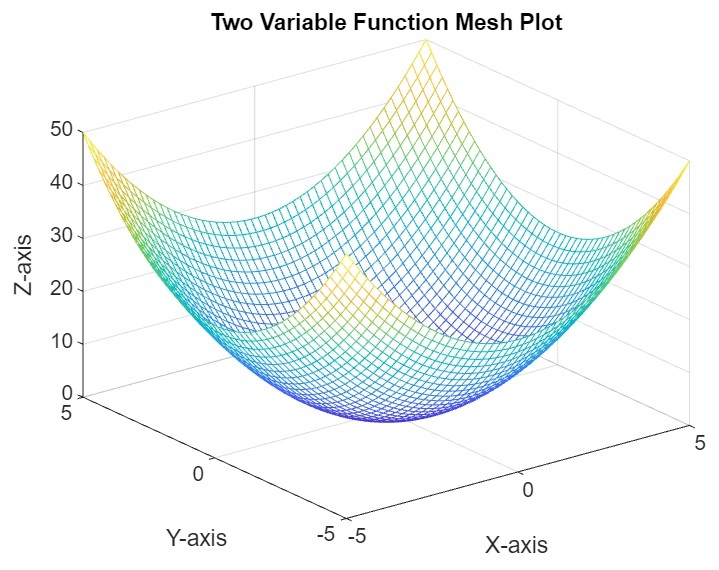
在 MATLAB 中,我們有一個名為“mesh”的函式,用於繪製函式的三維曲面圖。我們可以用它來繪製二元函式。
示例
以下示例演示瞭如何使用“mesh”函式繪製二元函式。
% MATLAB code to plot function of two-variable using mesh surface plot
% Define the range of x and y points
x = linspace(-5, 5, 50);
y = linspace(-5, 5, 50);

% Create a grid of x and y points
[X, Y] = meshgrid(x, y);

% Define a function of two variables
Z = X.^2 + Y.^2;

% Plot the function using the mesh surface plot
mesh(X, Y, Z);
title('Two Variable Function Mesh Plot');
xlabel('X-axis');
ylabel('Y-axis');
zlabel('Z-axis');
輸出
使用曲面圖繪製二元函式
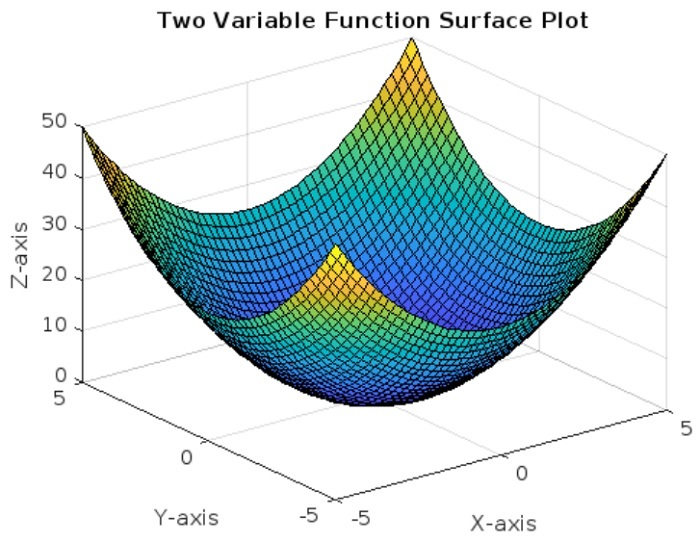
在 MATLAB 中,我們還可以使用曲面圖繪製二元函式。為此,MATLAB 庫中有一個名為“surf”的內建函式,它可以為定義的函式繪製三維曲面圖。
示例
讓我們來看一個示例,瞭解如何在 MATLAB 中使用“surf”函式繪製二元函式。
% MATLAB code to plot a function of two-variable using surface plot
% Define the range of x and y points
x = linspace(-5, 5, 50);
y = linspace(-5, 5, 50);

% Create a grid of x and y points
[X, Y] = meshgrid(x, y);

% Define a function of two variables
Z = X.^2 + Y.^2;

% Plot the function using the 3D surface plot
surf(X, Y, Z);
title('Two Variable Function Surface Plot');
xlabel('X-axis');
ylabel('Y-axis');
zlabel('Z-axis');
輸出
使用散點圖繪製二元函式
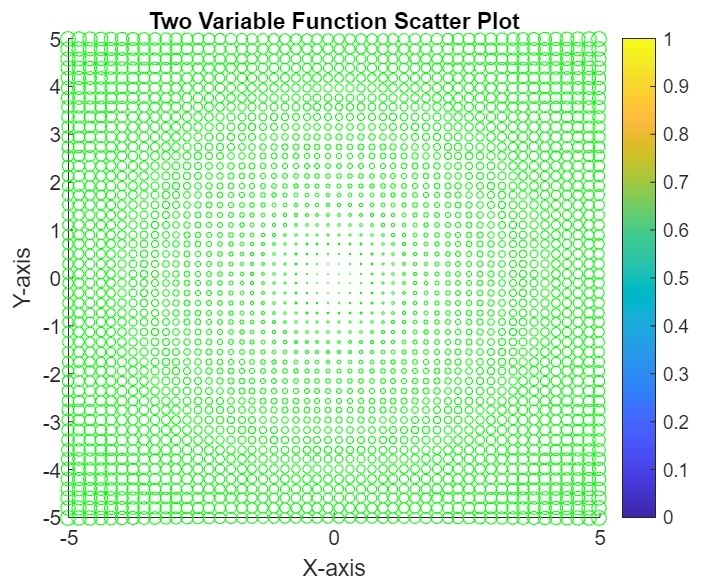
我們還可以使用散點圖繪製二元函式。為此,MATLAB 中有一個名為“scatter”的內建函式。
示例
這是一個演示如何使用散點圖繪製二元函式的示例。
% MATLAB code to plot a function of two-variable using scatter plot
% Define the range of x and y points
x = linspace(-5, 5, 50);
y = linspace(-5, 5, 50);

% Create a grid of x and y points
[X, Y] = meshgrid(x, y);

% Define a function of two variables
Z = X.^2 + Y.^2;

% Plot the function using the scatter plot
scatter(X(:), Y(:), Z(:), 'green');
title('Two Variable Function Scatter Plot');
xlabel('X-axis');
ylabel('Y-axis');
colorbar;	% Z values
輸出
使用等高線圖繪製二元函式
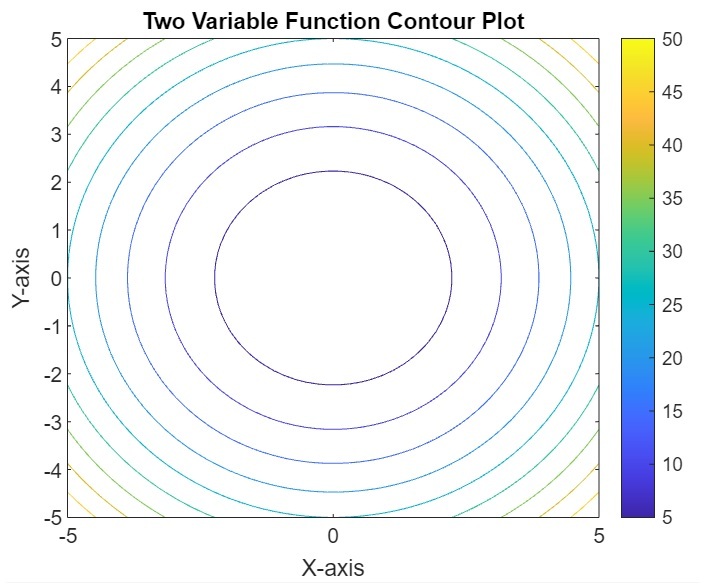
在 MATLAB 中,我們可以使用等高線圖繪製二元函式。為此,我們在 MATLAB 中使用“contour”函式。
示例
以下示例顯示了使用等高線圖繪製二元函式的 MATLAB 程式碼實現。
% MATLAB code to plot a function of two-variable using contour plot
% Define the range of x and y points
x = linspace(-5, 5, 50);
y = linspace(-5, 5, 50);

% Create a grid of x and y points
[X, Y] = meshgrid(x, y);

% Define a function of two variables
Z = X.^2 + Y.^2;

% Plot the function using the contour plot
contour(X, Y, Z);
title('Two Variable Function Contour Plot');
xlabel('X-axis');
ylabel('Y-axis');
colorbar;	% Z values
輸出
結論
在 MATLAB 中,我們可以使用不同型別的繪圖來繪製二元函式。在本教程中,我解釋了在 MATLAB 中繪製二元函式的分步過程和示例。您也可以嘗試使用不同的函式編寫所有這些程式碼。

更新於:2023年10月6日
531 次瀏覽

廣告