
 資料結構
資料結構 網路
網路 RDBMS
RDBMS 作業系統
作業系統 Java
Java iOS
iOS HTML
HTML CSS
CSS Android
 Python
 C 程式設計
 C++
C++ C#
C# MongoDB
 MySQL
MySQL Javascript
 PHP
PHP如何在 R 中透過 ggplot2 繪製函式?
使用 curve 函式非常容易繪製函式,但我們也可以使用 ggplot2 來繪製函式。由於 ggplot2 能提供更好看的圖,因此它通常用於繪製圖,而不是使用其他繪圖函式。若要繪製函式,應在 ggplot 中 stat_function 中指定函式。
示例
考慮以下資料幀 −
> x<-1:10
> df<-data.frame(x)
載入 ggplot2 包 −
> library(ggplot2)
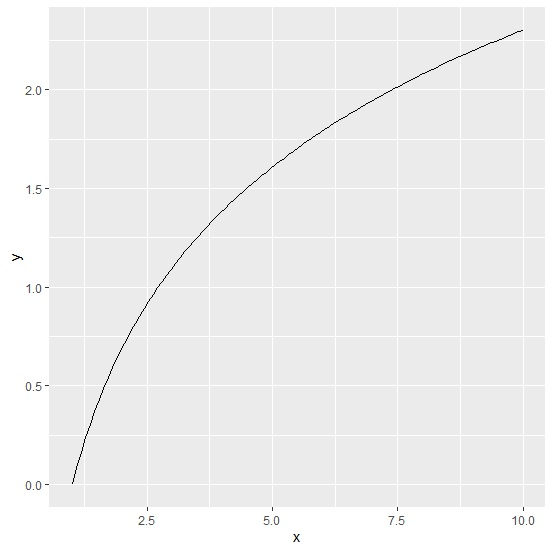
函式的繪製如下所示
> ggplot(df,aes(x))+
+ stat_function(fun=function(x) log(x))
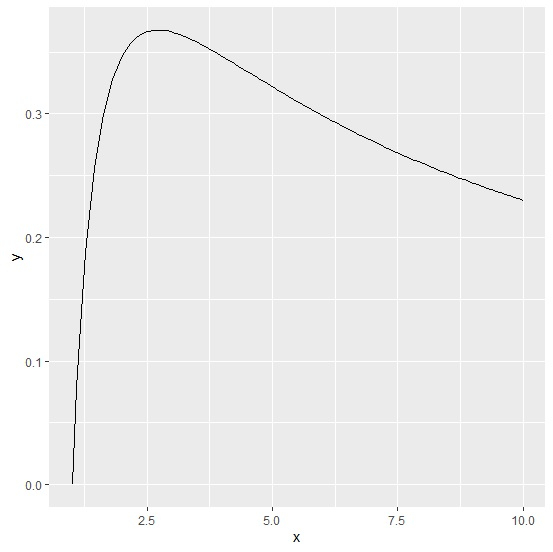
> ggplot(df,aes(x))+
+ stat_function(fun=function(x) log(x)/x)
輸出
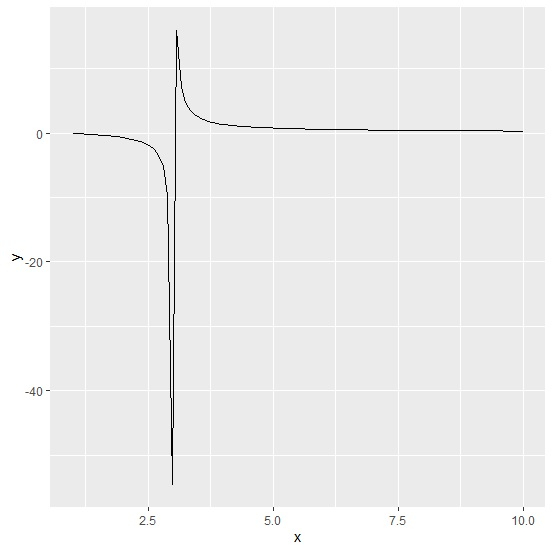
> ggplot(df,aes(x))+
+ stat_function(fun=function(x) log(x)/(x-3))
輸出
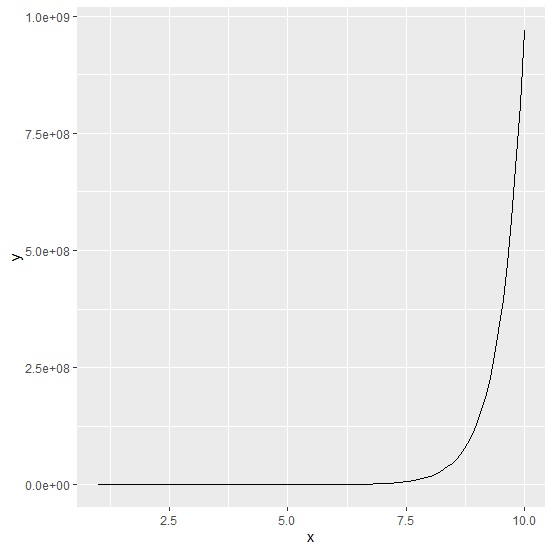
> ggplot(df,aes(x))+
+ stat_function(fun=function(x) (exp(x)^2)*2)
輸出

更新於:12-Aug-2020
5K+ 瀏覽量

廣告