
 資料結構
資料結構 網路
網路 關係資料庫管理系統
 作業系統
作業系統 Java
Java iOS
iOS HTML
HTML CSS
CSS Android
 Python
 C 程式設計
 C++
C++ C#
C# MongoDB
 MySQL
MySQL Javascript
 PHP
PHP如何修改建立後的 Matplotlib 圖例?
在建立 Matplotlib 圖例後對其進行修改時,我們可以有多種方法。
- 設定影像大小,並調整子圖之間的內邊距和周圍的內邊距。
- 使用 plot() 方法、兩個列表和一個標籤繪製一條線。
- 使用 legend() 方法在影像上放置圖例。
- 要修改 Matplotlib 圖例,請使用 set_title() 方法。
- 要顯示圖形,請使用 show() 方法。
示例
from matplotlib import pyplot as plt
plt.rcParams["figure.figsize"] = [7.50, 3.50]
plt.rcParams["figure.autolayout"] = True
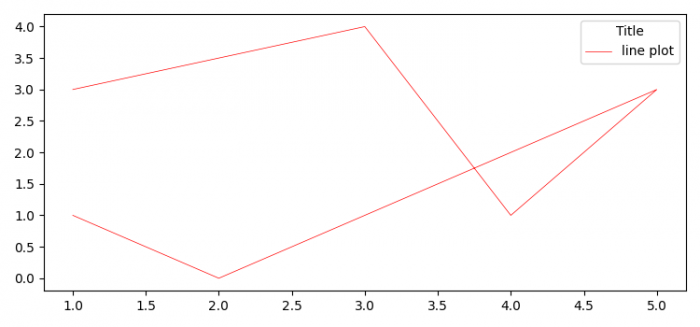
plt.plot([1, 3, 4, 5, 2, 1], [3, 4, 1, 3, 0, 1],
label="line plot", color='red', lw=0.5)
leg = plt.legend(loc="upper right")
leg.set_title("Title")
plt.show()輸出

更新於: 18-6-2021
2000+ 次瀏覽

廣告