
 資料結構
資料結構 網路
網路 RDBMS
RDBMS 作業系統
作業系統 Java
Java iOS
iOS HTML
HTML CSS
CSS Android
 Python
 C 程式設計
 C++
C++ C#
C# MongoDB
 MySQL
MySQL Javascript
 PHP
PHP如何對 Matplotlib 圖表的凡例進行定位和對齊?
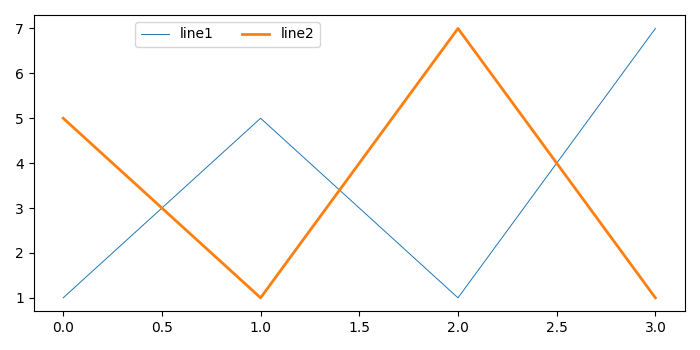
要對 matplotlib 圖表的凡例進行定位和對齊,我們可以採取以下步驟-
- 使用 plot() 方法繪製 line1 和 line2。
- 在圖表中放置一個凡例。使用 bbox_to_anchor 設定位置並對齊凡例元素。
- 要顯示圖表,使用 show() 方法。
示例
from matplotlib import pyplot as plt
plt.rcParams["figure.figsize"] = [7.00, 3.50]
plt.rcParams["figure.autolayout"] = True
line1, = plt.plot([1, 5, 1, 7], linewidth=0.7)
line2, = plt.plot([5, 1, 7, 1], linewidth=2.0)
plt.legend([line1, line2], ["line1", "line2"], bbox_to_anchor=(0.45, 1.0), ncol=2)
plt.show()
輸出

更新日期:2021 年 5 月 15 日
1 千次以上瀏覽

廣告