
 資料結構
資料結構 網路
網路 關係資料庫管理系統
 作業系統
作業系統 Java
Java iOS
iOS HTML
HTML CSS
CSS Android
 Python
 C 程式設計
 C++
C++ C#
C# MongoDB
 MySQL
MySQL JavaScript
 PHP
PHP在 Matplotlib 中建立兩張子圖後如何共享它們的 x 軸?
首先,我們可以使用 subplot 方法建立兩個軸,其中 nrows=2,ncols=1。這意味著,我們可以有兩個索引來繪製所需的圖形。我們可以對圖形使用 ax1.get_shared_x_axes().join(ax1,ax2) 方法。
步驟
建立兩個數字列表。
將子圖新增到當前影像中,ax1,其中 nrows = 2,ncols = 1,並且對於 ax1,索引為 1。
將子圖新增到當前影像中,ax2,其中 nrows = 2,ncols = 1,並且對於 ax2,索引為 2。
使用在步驟 1 中建立的點繪製 x 和 y。
使用 get_shared_x_axes().join(ax1, ax2),返回一個引用,以共享軸 Grouper 物件作為軸。
使用 set_xticklabels 方法,使用空列表設定網格的 x 軸刻度標籤。
使用 plt.show() 來顯示影像。
示例
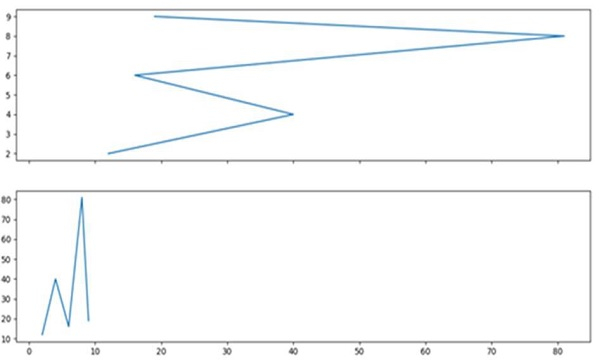
import matplotlib.pyplot as plt

x = [2, 4, 6, 8, 9]
y = [12, 40, 16, 81, 19]

ax1 = plt.subplot(211)
ax2 = plt.subplot(212)

ax1.plot(y, x)
ax2.plot(x, y)

ax1.get_shared_x_axes().join(ax1, ax2)
ax1.set_xticklabels([])

plt.show()
輸出

更新於: 15-03-2021
2K+ 檢視

廣告