
 資料結構
資料結構 網路
網路 RDBMS
RDBMS 作業系統
作業系統 Java
Java iOS
iOS HTML
HTML CSS
CSS Android
 Python
 C 程式設計
 C++
C++ C#
C# MongoDB
 MySQL
MySQL Javascript
 PHP
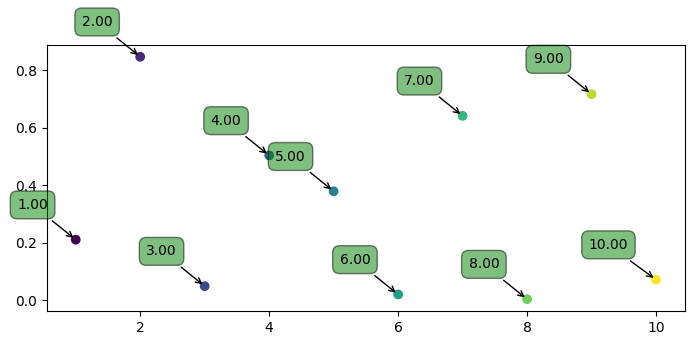
PHP如何改善 Matplotlib 散點圖的標籤放置?
要改善 matplotlib 散點圖的標籤放置,我們可以首先繪製散點,然後用標籤為這些點添加註釋。
步驟
使用 numpy 為x 和y 建立點。
使用xpoints 建立標籤。
使用 scatter() 方法繪製散點。
迭代標籤、xpoints 和ypoints 並使用不同的屬性為繪圖新增標籤、x 和 y。
要顯示圖形,請使用 show() 方法。
例
import numpy as np
from matplotlib import pyplot as plt
plt.rcParams["figure.figsize"] = [7.00, 3.50]
plt.rcParams["figure.autolayout"] = True
xpoints = np.linspace(1, 10, 10)
ypoints = np.random.rand(10)
labels = ["%.2f" % i for i in xpoints]
plt.scatter(xpoints, ypoints, c=xpoints)
for label, x, y in zip(labels, xpoints, ypoints):
   plt.annotate(
      label,
      xy=(x, y), xytext=(-20, 20),
      textcoords='offset points', ha='right', va='bottom',
      bbox=dict(boxstyle='round,pad=0.5', fc='green', alpha=0.5),
      arrowprops=dict(arrowstyle='->', connectionstyle='arc3,rad=0'))
plt.show()
輸出

更新於:06-May-2021
1K+ 瀏覽

廣告