
 資料結構
資料結構 網路
網路 RDBMS
RDBMS 作業系統
作業系統 Java
Java iOS
iOS HTML
HTML CSS
CSS Android
 Python
 C 程式設計
 C++
C++ C#
C# MongoDB
 MySQL
MySQL Javascript
 PHP
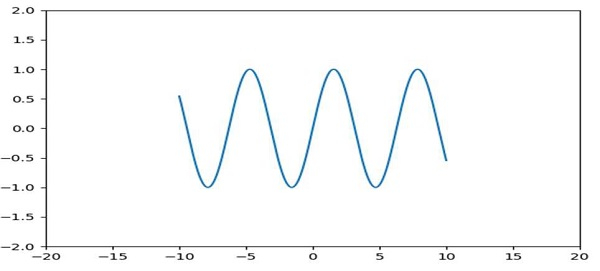
PHP如何在 Matplotlib 中強制執行軸範圍?
要在 matplotlib 中強制執行軸範圍,我們可以採取以下步驟 -
分別使用 xlim 和 ylim 方法設定 x 和 y 範圍。
使用 numpy 為曲線建立 x 和 y 點。
使用 plot()方法繪製 x 和 y。
要顯示圖形,請使用 show()方法。
示例
import matplotlib.pyplot as plt
import datetime
import numpy as np
plt.rcParams["figure.figsize"] = [7.50, 3.50]
plt.rcParams["figure.autolayout"] = True
x = np.array([datetime.datetime(2021, 1, 1, i, 0) for i in range(24)])
y = np.random.randint(100, size=x.shape)
plt.plot(x, y)
plt.show()
輸出

更新於: 09-Apr-2021
631 檢視

廣告