
 資料結構
資料結構 網路
網路 RDBMS
RDBMS 作業系統
作業系統 Java
Java iOS
iOS HTML
HTML CSS
CSS Android
 Python
 C語言
C語言 C++
C++ C#
C# MongoDB
 MySQL
MySQL Javascript
 PHP
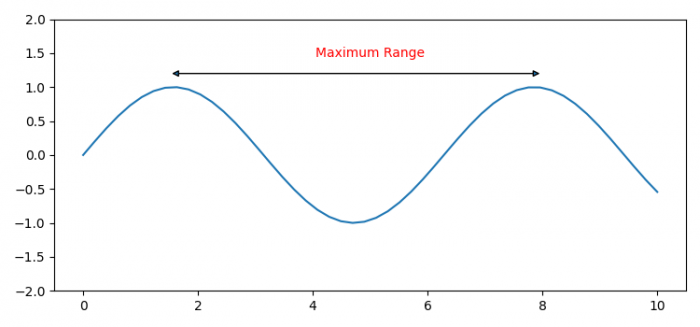
PHP如何在Matplotlib中註釋X軸的範圍?
若要在 Matplotlib 中註釋 X 軸的範圍,我們可以採取以下步驟:
- 設定圖形大小並調整子圖之間和周圍的邊距。
- 使用 Numpy 建立 xx 和 yy 資料點。
- 建立一個圖形和一組子圖。
- 使用 plot() 方法繪製 xx 和 yy 資料點。
- 設定軸的 ylim。
- 使用 annotate 方法放置箭頭和範圍標籤名稱。
- 若要顯示圖形,請使用 show() 方法。
示例
import matplotlib.pyplot as plt
import numpy as np

plt.rcParams["figure.figsize"] = [7.50, 3.50]
plt.rcParams["figure.autolayout"] = True

xx = np.linspace(0, 10)
yy = np.sin(xx)

fig, ax = plt.subplots(1, 1)

ax.plot(xx, yy)
ax.set_ylim([-2, 2])

ax.annotate('', xy=(5,2), xytext=(8,2),
            xycoords='data', textcoords='data',
            arrowprops={'arrowstyle': '<|-|>'}, color='yellow')

ax.annotate('Maximum Range', xy=(5,5), ha='center', va='center', color='red')

plt.show()
輸出


更新於:2021 年 8 月 4 日
1K+ 瀏覽量

廣告