
 資料結構
資料結構 網路
網路 RDBMS
RDBMS 作業系統
作業系統 Java
Java iOS
iOS HTML
HTML CSS
CSS Android
 Python
 C 程式設計
 C++
C++ C#
C# MongoDB
 MySQL
MySQL Javascript
 PHP
PHP如何在 Matplotlib 中訪問軸標籤物件?
如需在 Matplotlib 中訪問軸標籤物件,我們可以使用 ax.xaxis.get_label().get_text() 方法。
步驟
- 設定圖形大小並調整子圖表間以及子圖表周圍的填充。
- 建立一個圖形和一組子圖表。
- 初始化一個變數,N,用於表示樣本數。
- 使用 numpy 建立隨機資料點。
- 使用 plot() 方法繪製 **x** 資料點。
- 使用 set_xlabel() 方法設定 X 軸標籤。
- 如需獲取 xlabel,請使用 get_label() 方法和 get_text() 方法。
- 如需顯示圖形,請使用 show() 方法。
示例
import numpy as np
import matplotlib.pyplot as plt
plt.rcParams["figure.figsize"] = [7.50, 3.50]
plt.rcParams["figure.autolayout"] = True
fig, ax = plt.subplots()
N = 100
x = np.random.rand(N)
ax.plot(x)
ax.set_xlabel("X-axis")
x_lab = ax.xaxis.get_label()
print("Label is: ", x_lab.get_text())
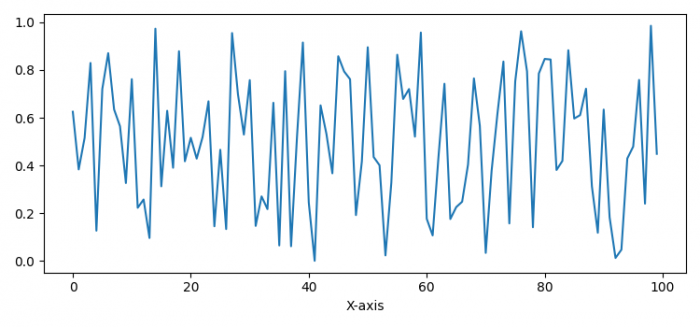
plt.show()輸出

更新於: 2021 年 6 月 15 日
2000+ 個瀏覽量

廣告