
 資料結構
資料結構 網路
網路 RDBMS
RDBMS 作業系統
作業系統 Java
Java iOS
iOS HTML
HTML CSS
CSS Android
 Python
 C 程式設計
 C++
C++ C#
C# MongoDB
 MySQL
MySQL Javascript
 PHP
PHP如何降低 Matplotlib 中的網格密度?
要降低 Matplotlib 中的網格密度,我們可以採取以下步驟 −
設定圖形大小並調整子圖之間和周圍的邊距。
製作一個自定義水平網格類來覆蓋密度。
附加水平網格類。
建立一個新圖形或啟用現有圖形。
將'ax1'作為子圖排列的一部分新增到圖形中。
製作資料點列表。
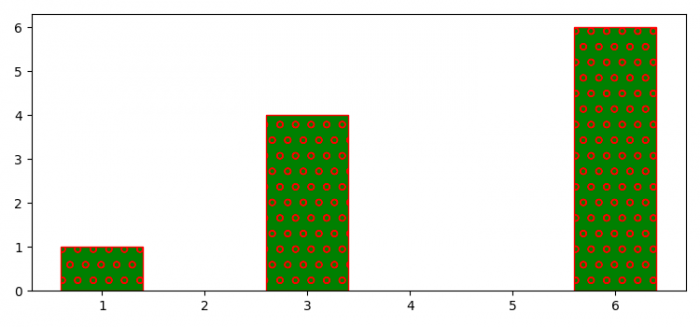
用x和y資料點製作一個條形圖,其中hatch='o', color='green'和edgecolor='red'。
使用show()方法來顯示圖形。
示例
from matplotlib import pyplot as plt, hatch

plt.rcParams["figure.figsize"] = [7.50, 3.50]
plt.rcParams["figure.autolayout"] = True

class MyHorizontalHatch(hatch.HorizontalHatch):
   def __init__(self, hatch, density):
      char_count = hatch.count('o')
      if char_count > 0:
         self.num_lines = int((1.0 / char_count) * density)
      else:
         self.num_lines = 0
      self.num_vertices = self.num_lines * 2
      super().__init__(hatch, density)

hatch._hatch_types.append(MyHorizontalHatch)

fig = plt.figure()

ax1 = fig.add_subplot(111)

x = [3, 6, 1]
y = [4, 6, 1]

ax1.bar(x, y, color='green', edgecolor='red', hatch="o", lw=1., zorder=0)

plt.show()
輸出

更新於:2021-09-23
623 次瀏覽

廣告