
 資料結構
資料結構 網路
網路 RDBMS
RDBMS 作業系統
作業系統 Java
Java iOS
iOS HTML
HTML CSS
CSS Android
 Python
 C 程式設計
 C++
C++ C#
C# MongoDB
 MySQL
MySQL Javascript
 PHP
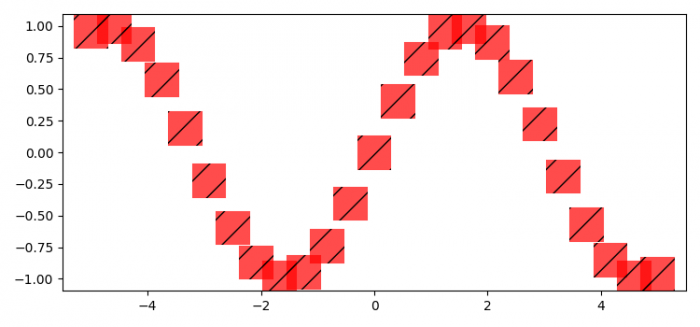
PHP如何改變 Matplotlib 中陰影的線寬?
若要更改 matplotlib 中陰影的線寬,我們可以在 params 中設定陰影的線寬。
步驟
- 設定圖形大小並調整子圖之間的以及子圖周圍的空白。
- 使用 numpy 建立 x 和 y=sin(x) 資料點。
- 在繪圖中設定陰影的線寬。
- 使用 scatter() 方法繪製 x 和 y 資料點,其中帶有具有設定的線寬的“/”陰影的正方形標記。
- 要顯示圖形,請使用 show() 方法。
示例
import numpy as np
from matplotlib import pyplot as plt
plt.rcParams["figure.figsize"] = [7.50, 3.50]
plt.rcParams["figure.autolayout"] = True
x = np.linspace(-5, 5, 25)
y = np.sin(x)
plt.rcParams['hatch.linewidth'] = 1
plt.scatter(x, y, s=700, marker='s', linewidth=0.05, facecolor='red',
hatch='/', alpha=.7)
plt.show()
輸出

更新於: 2021 年 6 月 1 日
2 千次以上瀏覽

廣告