
 資料結構
資料結構 網路
網路 關係資料庫管理系統
 作業系統
作業系統 Java
Java iOS
iOS HTML
HTML CSS
CSS Android
 Python
 C程式設計
C程式設計 C++
C++ C#
C# MongoDB
 MySQL
MySQL Javascript
 PHP
PHP如何在MATLAB中建立對數刻度
MATLAB有三個內建函式“semilogx”,“semilogy”和“loglog”,用於將繪圖中的線性軸刻度轉換為對數刻度。
這裡,“semilogx()”函式用於將X軸刻度更改為對數刻度。“semilogy()”函式用於將Y軸刻度更改為對數刻度。“loglog()”函式將X軸和Y軸刻度都更改為對數刻度。
語法
semilogx(x, y);
semilogy(x, y);
loglog(x, y);
以下MATLAB程式演示瞭如何使用“semilogx()”,“semilogy()”和“loglog()”函式在MATLAB中將軸刻度更改為對數刻度。
示例
% MATLAB program to change axis scales to logarithmic scale
% Create sample data vectors
x = linspace(1, 10, 10);
y = x.^3;
% Plot the data using various logarithmic scales
figure;

% Changing X-axis scale to logarithmic using semilogx function
subplot(1, 3, 1);
semilogx(x, y);
xlabel('x-axis (semilogx)');
ylabel('y-axis');
title('Semilogx Plot');

% Changing Y-axis scale to logarithmic using semilogy function
subplot(1, 3, 2);
semilogy(x, y);
xlabel('x-axis');
ylabel('y-axis (semilogy)');
title('Semilogy Plot');

% Changing both X-axis and Y-axis scales to logarithmic using loglog function
subplot(1, 3, 3);
loglog(x, y);
xlabel('x-axis (loglog)');
ylabel('y-axis (loglog)');
title('Loglog Plot');
% Adjust subplot spacing with a title
sgtitle('Logarithmic Scale Plots');
輸出
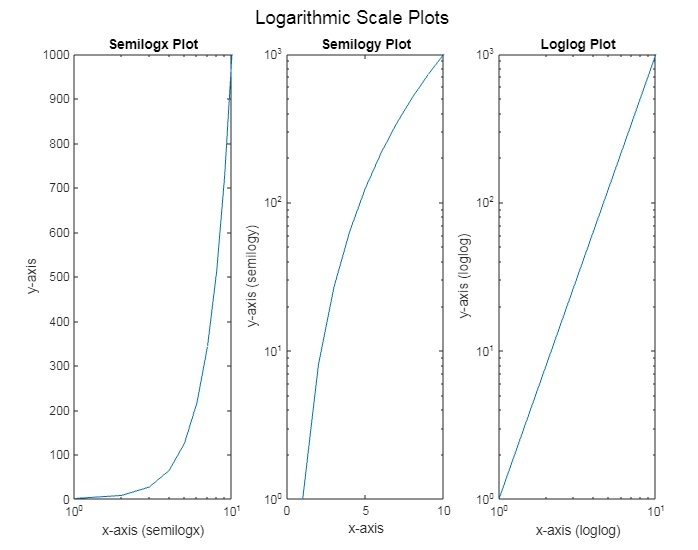
結論
在上面的MATLAB程式中,我們首先建立樣本資料向量“x”。然後,我們計算“x”值的立方並將其儲存在另一個向量“y”中。接下來,我們開始繪製x和y值的圖形。此外,我們指定函式“semilogx()”,“semilogy()”和“loglog()”將軸刻度更改為對數刻度,如下所述。
在第一個子圖中,我們使用“semilogx”函式將X軸刻度更改為對數刻度。
在第二個子圖中,我們使用“semilogy”函式將Y軸刻度更改為對數刻度。
在第三個子圖中,我們使用“loglog”函式將X軸和Y軸刻度都更改為對數刻度。
最後,我們呼叫MATLAB的“sgtitle”函式在繪圖圖形中顯示主標題“對數刻度圖”。
這就是我們在MATLAB中將線性軸刻度轉換為對數刻度的方法。

更新於:2023年7月18日
920 次瀏覽

廣告