
 資料結構
資料結構 網路
網路 關係資料庫管理系統
 作業系統
作業系統 Java
Java iOS
iOS HTML
HTML CSS
CSS Android
 Python
 C 程式設計
 C++
C++ C#
C# MongoDB
 MySQL
MySQL Javascript
 PHP
PHP如何在 Python Plotly 中更改 Dash 圖表的大小?
Plotly 支援兩個不同的庫:“Dash 應用中的 Plotly 圖表”和“Plotly Express 中的 Plotly 圖表物件”。Dash 是一個 Python 框架,用於建立互動式的基於 Web 的儀表板應用程式。dash 庫為基於 Web 的儀表板應用程式添加了所有必需的庫。
匯入dash核心元件和 html 元件。新增 plotly.express 方法以生成圖形。使用Dcc.Graph()方法設定高度和寬度座標的樣式。
在本教程中,我們將演示如何在單個瀏覽器頁面上向 Plotly Dash 應用程式新增多個圖形。請按照以下步驟在單個頁面上生成 Dash 應用程式。
步驟 1
匯入 Dash 庫。
import dash
步驟 2
匯入 Dash 核心元件,dcc 和 html
from dash import dcc, html
步驟 3
使用以下模組匯入 dash 依賴項:
from dash.dependencies import Input, Output
步驟 4
匯入plotly.express模組並將其別名為px
import plotly.express as px
步驟 5
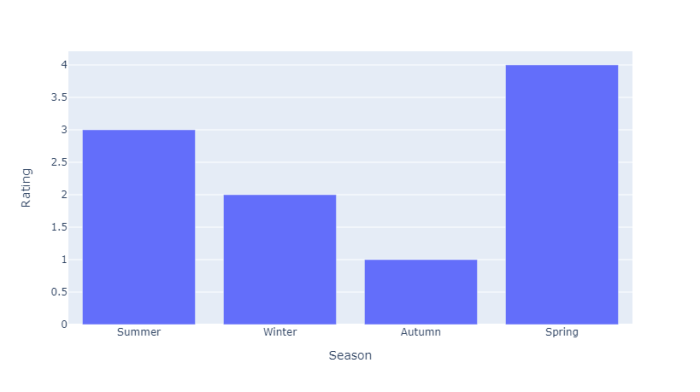
使用 Pandas 模組生成資料集。讓我們使用以下方法生成資料集:
# import pandas module
import pandas as pd

df_bar = pd.DataFrame({
   "Season": ["Summer", "Winter", "Autumn", "Spring"],
   "Rating": [3,2,1,4]
})
步驟 6
使用以下座標生成條形圖,並將其儲存在fig變數中。
fig = px.bar(df_bar, x="Season", y="Rating", barmode="group")
步驟 7
建立main函式以使用以下命令執行應用程式伺服器:
app = dash.Dash(__name__)
if __name__ == '__main__':
   app.run_server(debug=True)
步驟 8
為 div 部分中的html子元素生成應用程式佈局。定義如下:
app.layout = html.Div(children=[

   # elements from the top of the page
   html.Div([html.H1(children='Dash app1'),
   html.Div(children='''Dash: First graph.'''),
   dcc.Graph(id='graph1',figure=fig),]),

   # New Div for all elements in the new 'row' of the page
   html.Div([
      html.H1(children='Dash app2'),
      html.Div(children='''Dash: Second graph.'''),
      dcc.Graph(id='graph2', figure=fig),
   ]),
])
示例
以下是更改 Plotly 中 Dash 圖表大小的完整程式碼:
import dash
from dash import dcc, html
import pandas as pd
import plotly.express as px

app = dash.Dash(__name__)
df_bar = pd.DataFrame({
   "Season": ["Summer", "Winter", "Autumn", "Spring"],
   "Rating": [3, 2, 1, 4]
})

fig = px.bar(df_bar, x="Season", y="Rating", barmode="group")

# app layout for html div and set height and width
app.layout = html.Div(children=[

   # All elements from the top of the page
   html.Div([
      html.H1(children='Dash app1'),
      html.Div(children='''
         Dash: First graph.
      '''),

      dcc.Graph(
         id='graph1',
         figure=fig,
         style={'width': '60vw', 'height': '70vh'}
      ),
   ])
])

if __name__ == '__main__':
   app.run_server(debug=True)
輸出
它將在控制檯上顯示以下輸出。
Dash is running on http://127.0.0.1:8050/
 * Serving Flask app 'main'
 * Debug mode: on
單擊 URL,它將在瀏覽器上顯示以下輸出:
觀察我們如何在“dcc.Graph()”中使用“style”屬性來更改 Dash 圖表的大小。

更新於: 2022-10-07
3K+ 瀏覽量

廣告