
 資料結構
資料結構 網路
網路 RDBMS
RDBMS 作業系統
作業系統 Java
Java iOS
iOS HTML
HTML CSS
CSS Android
 Python
 C 程式設計
 C++
C++ C#
C# MongoDB
 MySQL
MySQL Javascript
 PHP
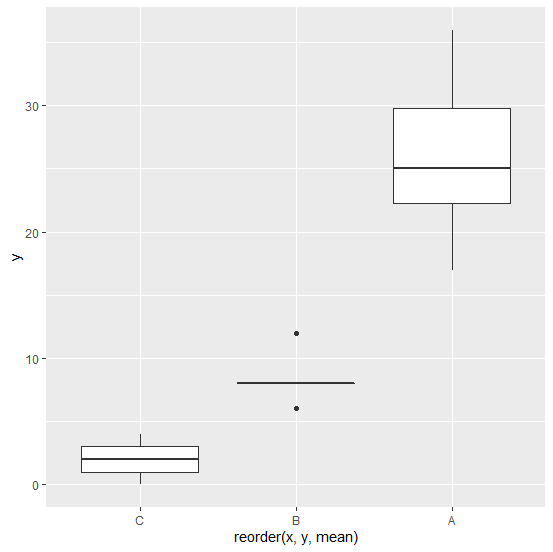
PHP如何在 R 中使用 ggplot2 按均值更改箱線圖的順序?
要按均值更改箱線圖的順序,我們可以在 ggplot 的 aes 中使用 reorder 函式。例如,如果我們有一個名為 df 的資料框,其中包含兩列,分別為 x(類別)和 y(計數),那麼我們可以按均值對資料框進行排序,並使用命令 ggplot(df,aes(x=reorder(x,y,mean),y))+geom_boxplot() 建立箱線圖。
示例
考慮以下資料框 −
> x<-c(rep(c("A","B","C"),times=c(10,5,5)))
> y<-c(rpois(10,25),rpois(5,10),rpois(5,2))
> df<-data.frame(x,y)
> df
輸出
   x  y
1  A 22
2  A 17
3  A 20
4  A 36
5  A 34
6  A 25
7  A 25
8  A 30
9  A 23
10 A 29
11 B  8
12 B  8
13 B  6
14 B  8
15 B 12
16 C  0
17 C  4
18 C  3
19 C  2
20 C  1
載入 ggplot2 包並針對 x 中的類別建立箱線圖 −
> library(ggplot2)
> ggplot(df,aes(x,y))+geom_boxplot()
輸出

針對 x 中的類別建立按 y 均值排序的箱線圖 −
> ggplot(df,aes(x=reorder(x,y,mean),y))+geom_boxplot()
輸出

更新於: 2021 年 3 月 6 日
743 次瀏覽

廣告