
 資料結構
資料結構 網路
網路 RDBMS
RDBMS 作業系統
作業系統 Java
Java iOS
iOS HTML
HTML CSS
CSS Android
 Python
 C 程式設計
 C++
C++ C#
C# MongoDB
 MySQL
MySQL Javascript
 PHP
PHP如何使用 ggplot2 在 R 中增加箱線圖中線條的寬度?
當我們使用 ggplot2 建立箱線圖時,箱線圖中線條的預設寬度非常細,我們可能希望增加寬度,以使觀察箱線圖邊緣的可見度更清晰。這將幫助檢視者一次性理解箱線圖的邊緣。我們可以透過使用 ggplto2 軟體包 geom_boxplot 函式的 lwd 引數來實現這一點。
示例
考慮以下資料幀 -
> ID<-rep(c("S1","S2","S3","S4"),times=100)
> Count<-sample(1:50,400,replace=TRUE)
> df<-data.frame(ID,Count)
> head(df,20)
輸出
 ID Count
1 S1 20
2 S2 14
3 S3 17
4 S4 30
5 S1 17
6 S2 23
7 S3 36
8 S4 10
9 S1 14
10 S2 28
11 S3 42
12 S4 10
13 S1 25
14 S2 12
15 S3 4
16 S4 38
17 S1 3
18 S2 45
19 S3 33
20 S4 43
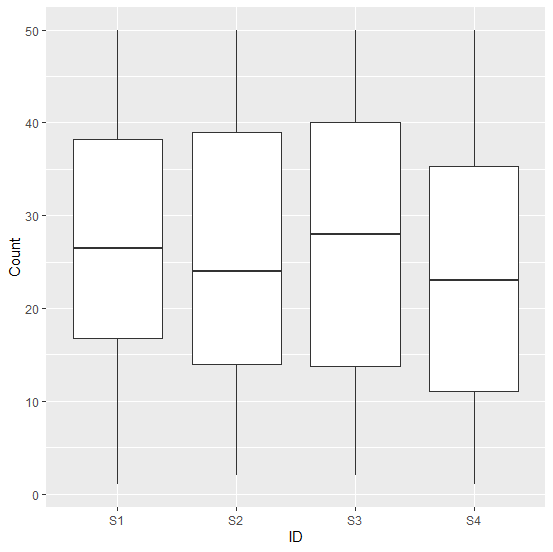
載入 ggplot2 軟體包並建立 ID 的計數箱線圖 -
> library(ggplot2)
> ggplot(df,aes(ID,Count))+geom_boxplot()
輸出
建立具有不同線條寬度的箱線圖 -
> ggplot(df,aes(ID,Count))+geom_boxplot(lwd=2)
輸出


更新於: 2020-09-08
3K+ 瀏覽量

廣告