
 資料結構
資料結構 網路
網路 RDBMS
RDBMS 作業系統
作業系統 Java
Java iOS
iOS HTML
HTML CSS
CSS 安卓
安卓 Python
 C 程式設計
 C++
C++ C#
C# MongoDB
 MySQL
MySQL Javascript
 PHP
PHP要如何使用 ggplot2 改變繪圖示題的調整位置,將其在 R 中對齊到 Y 軸標籤上方?
當我們建立一個繪圖並在其上方新增一個標題時,預設情況下該標題的對齊方式為左對齊,且位於繪圖區域的邊緣。但有時,我們希望在 Y 軸標籤的上方向中顯示標題,因此,我們可以使用主題函式,並相應地設定 hjust 引數。
示例
考慮以下資料框 −
x<-sample(1:50,20)
y<-rpois(20,2)
df<-data.frame(x,y)
df
輸出
   x  y
1  1  2
2  50 0
3  19 3
4  33 4
5  43 1
6  17 1
7  7  1
8  28 4
9  18 0
10 22 1
11 21 0
12 11 1
13 34 4
14  9 4
15  4 4
16 37 1
17 48 3
18 25 0
19  8 1
20 32 1
示例
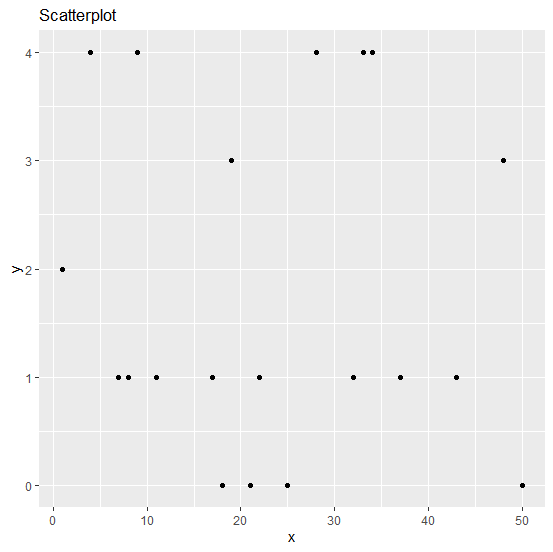
library(ggplot2)
ggplot(df,aes(x,y))+geom_point()+labs(title="Scatterplot")
輸出
示例
ggplot(df,aes(x,y))+geom_point()+labs(title="Scatterplot")+theme(plot.title=element_tex
t(hjust=-0.07))
輸出


更新於:08-Sep-2020
529 次瀏覽

廣告