
 資料結構
資料結構 網路
網路 RDBMS
RDBMS 作業系統
作業系統 Java
Java iOS
iOS HTML
HTML CSS
CSS Android
 Python
 C 程式設計
 C++
C++ C#
C# MongoDB
 MySQL
MySQL Javascript
 PHP
PHP如何在 matplotlib 中調整圖例標記和標籤之間的間距?
要調整圖例標記和標籤之間的間距,我們可以在圖例方法中使用 labelspacing。
步驟
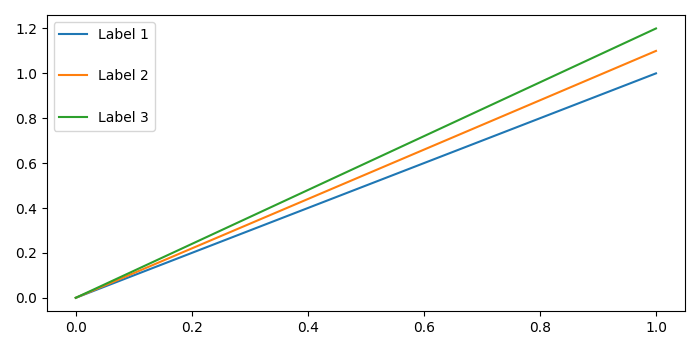
使用 label1、label2 和 label3 繪製線條。
初始化一個空間變數以增加或減少圖例標記和標籤之間的間距。
在引數中使用 legend 方法與 labelspacing 。
要顯示圖形,請使用 show() 方法。
示例
from matplotlib import pyplot as plt
plt.rcParams["figure.figsize"] = [7.00, 3.50]
plt.rcParams["figure.autolayout"] = True
plt.plot([0, 1], [0, 1.0], label='Label 1')
plt.plot([0, 1], [0, 1.1], label='Label 2')
plt.plot([0, 1], [0, 1.2], label='Label 3')
space = 2
plt.legend(labelspacing=space)
plt.show()
輸出

更新於: 11-May-2021
3K+ 瀏覽量

廣告