
 資料結構
資料結構 網路
網路 RDBMS
RDBMS 作業系統
作業系統 Java
Java iOS
iOS HTML
HTML CSS
CSS Android
 Python
 C 程式設計
 C++
C++ C#
C# MongoDB
 MySQL
MySQL Javascript
 PHP
PHP如何對 Matplotlib/Seaborn 子圖之間的空間進行調整以用於多圖佈局?
若要調整 matplotlib/seaborn 子圖之間的空間以用於多圖佈局,我們可以採取以下步驟
步驟
設定圖形大小並調整子圖之間及周圍的填充。
建立圖形和一組子圖。
調整子圖佈局引數。
為所有子圖建立 Seaborn 的箱線圖。
使用 Show() 方法顯示圖形。
例
import seaborn as sns
from matplotlib import pyplot as plt

plt.rcParams["figure.figsize"] = [7.00, 3.50]
plt.rcParams["figure.autolayout"] = True

fig, axes = plt.subplots(2, 2)

# Adjust the subplot layout parameters
fig.subplots_adjust(hspace=0.125, wspace=0.125)

# Create Seaborn boxplot for all the subplots
sns.boxplot(ax=axes[0, 0])
sns.boxplot(ax=axes[0, 1])
sns.boxplot(ax=axes[1, 0])
sns.boxplot(ax=axes[1, 1])

# Display the plot
plt.show()
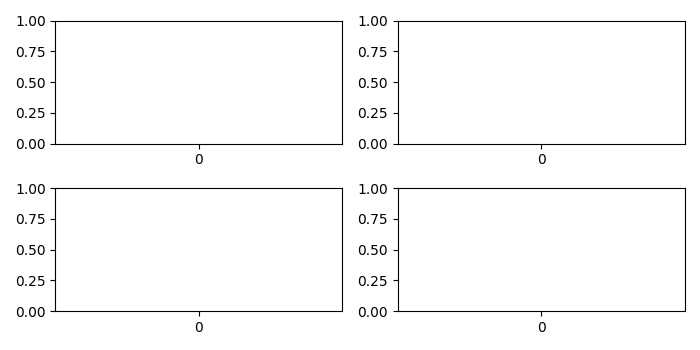
輸出
它將產生以下輸出 −

更新日期: 19-10-2021
6K+ 瀏覽量

廣告