
 資料結構
資料結構 網路
網路 RDBMS
RDBMS 作業系統
作業系統 Java
Java iOS
iOS HTML
HTML CSS
CSS Android
 Python
 C 程式設計
 C++
C++ C#
C# MongoDB
 MySQL
MySQL Javascript
 PHP
PHP如何在使用 Pandas' plot 建立的繪圖中新增共享 x 標籤和 y 標籤?(Matplotlib)
要新增共享 x 標籤和共享 y 標籤,我們可以使用 plot() 方法,並使用 kind="bar", sharex=True and sharey=True.
步驟
- 設定圖表大小,調整子圖之間及周圍的間距。
- 建立一個二維、尺寸可變的潛在異構表格資料。
- 使用 kind="bar", sharex=True and sharey=True. 繪製資料框。
- 要顯示圖表,請使用 show() 方法。
示例
import pandas as pd
import matplotlib.pyplot as plt
plt.rcParams["figure.figsize"] = [7.50, 3.50]
plt.rcParams["figure.autolayout"] = True
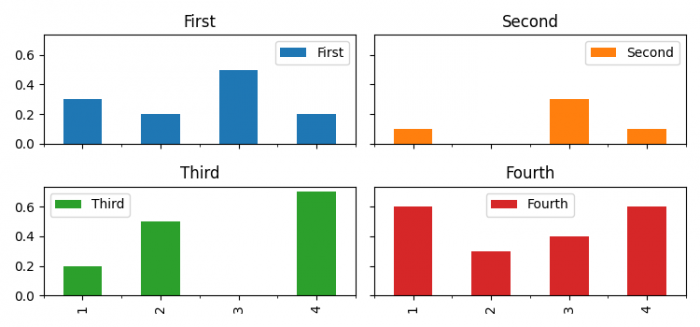
df = pd.DataFrame(
{'First': [0.3, 0.2, 0.5, 0.2], 'Second': [0.1, 0.0, 0.3, 0.1],
'Third': [0.2, 0.5, 0.0, 0.7], 'Fourth': [0.6, 0.3, 0.4, 0.6]},
index=list('1234'))
axes = df.plot(kind="bar", subplots=True, layout=(2, 2),
sharey=True, sharex=True)
plt.show()輸出

更新日期:16-Jun-2021
706 次瀏覽

廣告