
 資料結構
資料結構 網路
網路 RDBMS
RDBMS 作業系統
作業系統 Java
Java iOS
iOS HTML
HTML CSS
CSS Android
 Python
 C 程式設計
 C++
C++ C#
C# MongoDB
 MySQL
MySQL Javascript
 PHP
PHP如何在 Matplotlib 中以程式設計方式選擇一個特定子圖?
要在 matplotlib 中選擇一個特定子圖,我們可以採取以下步驟 −
設定圖形大小並調整子圖之間和周圍的填充。
使用 **figure()** 方法建立一個新圖形或啟用一個現有圖形。
在一個範圍內迭代,即設定要放置的子圖編號。
然後在迴圈中,使用 **add_subplot()** 方法在子圖排列中將 **'~.axes.Axes'** 新增到圖形中。
現在,用紅色選擇一條座標軸曲線。
要顯示圖形,請使用 **show()** 方法。
示例
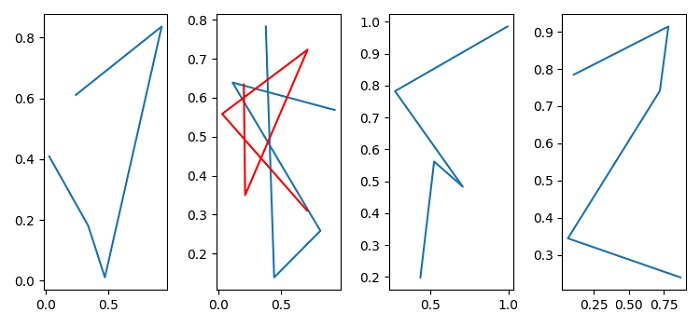
import numpy as np
import matplotlib.pyplot as plt

plt.rcParams["figure.figsize"] = [7.50, 3.50]
plt.rcParams["figure.autolayout"] = True

fig = plt.figure()

for index in [1, 2, 3, 4]:
   ax = fig.add_subplot(1, 4, index)
   ax.plot(np.random.rand(5), np.random.rand(5))

ax = fig.add_subplot(1, 4, 2)
ax.plot(np.random.rand(5), np.random.rand(5), color='red')

plt.show()
輸出

更新於: 03-06-2021
585 次瀏覽

廣告