
 資料結構
資料結構 網路
網路 關係型資料庫管理系統
 作業系統
作業系統 Java
Java iOS
iOS HTML
HTML CSS
CSS Android
 Python
 C 程式設計
 C++
C++ C#
C# MongoDB
 MySQL
MySQL Javascript
 PHP
PHP將 Pandas DataFrame.plot 填充到 Matplotlib 子圖中
若要將 Pandas 資料幀圖填充到 Matplotlib 子圖中,我們可以採取以下步驟 -
- 設定圖形大小並調整子圖之間以及周圍的填充。
- 建立一個圖形和一組子圖,即兩個軸。
- 使用 DataFrame. 建立 Pandas 資料幀。
- 使用 DataFrame.plot() 方法進行繪製。
- 若要顯示圖形,可以使用 show() 方法。
示例
import pandas as pd
import matplotlib.pyplot as plt
plt.rcParams["figure.figsize"] = [7.50, 3.50]
plt.rcParams["figure.autolayout"] = True
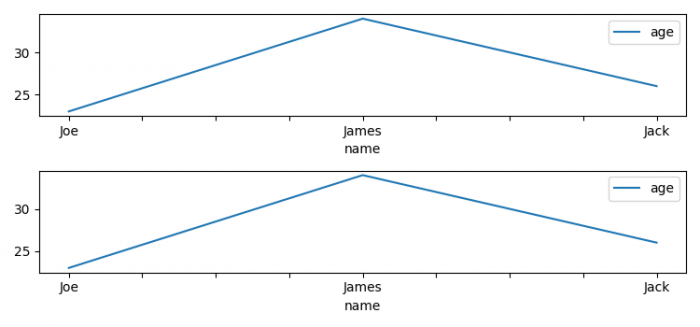
fig, (ax1, ax2) = plt.subplots(2)
df = pd.DataFrame(dict(name=["Joe", "James", "Jack"], age=[23, 34, 26]))
df.set_index("name").plot(ax=ax1)
df.set_index("name").plot(ax=ax2)
plt.show()輸出

更新於:10-6-2021
2000+ 訪問量

廣告