
 資料結構
資料結構 網路
網路 RDBMS
RDBMS 作業系統
作業系統 Java
Java iOS
iOS HTML
HTML CSS
CSS Android
 Python
 C 程式設計
 C++
C++ C#
C# MongoDB
 MySQL
MySQL Javascript
 PHP
PHP如何在 Matplotlib 的其他子圖中繪製 pcolor 顏色條?
若要使用 Matplotlib 在另一個子圖中繪製pcolor 顏色條, 我們可執行以下步驟 −
- 設定圖形大小及調整子圖間及周圍的邊距。
- 建立具有兩行兩列的圖形和一組子圖。
- 列出一些色圖。
- 迭代軸並建立一個具有不規則矩形網格的偽彩色圖。
- 使用pcolormesh 的相同軸建立色標。
- 使用 show() 方法顯示圖形。
示例
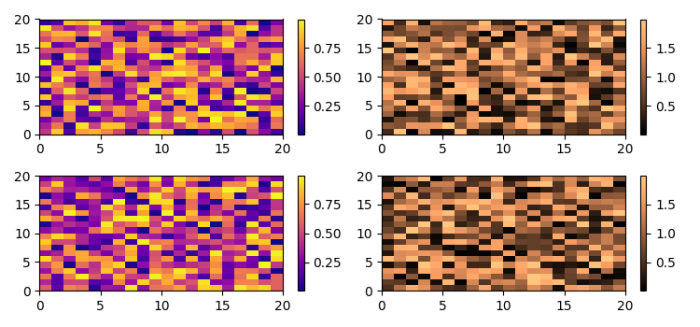
import matplotlib.pyplot as plt
import numpy as np

plt.rcParams["figure.figsize"] = [7.50, 3.50]
plt.rcParams["figure.autolayout"] = True

fig, axs = plt.subplots(2, 2)
cm = ['plasma', 'copper']

for col in range(2):
   for row in range(2):
      ax = axs[row, col]
      pcm = ax.pcolormesh(np.random.random((20, 20)) * (col + 1), cmap=cm[col])
      fig.colorbar(pcm, ax=ax)

plt.show()
輸出

更新日期: 2021 年 7 月 7 日
3K+ 瀏覽

廣告