- GWT HighCharts 教程
- GWT HighCharts - 主頁
- GWT HighCharts - 概述
- 環境設定
- 配置語法
- GWT HighCharts - 折線圖
- GWT Highcharts - 面積圖
- GWT HighCharts - 條形圖
- GWT Highcharts - 柱狀圖
- GWT Highcharts - 餅狀圖
- GWT Highcharts - 散點圖
- GWT Highcharts - 動態圖表
- GWT Highcharts - 組合圖
- GWT Highcharts - 3D 圖表
- GWT Highcharts - 地圖圖表
- GWT Highcharts 有用資源
- GWT Highcharts - 快速指南
- GWT Highcharts - 有用資源
- GWT Highcharts - 討論
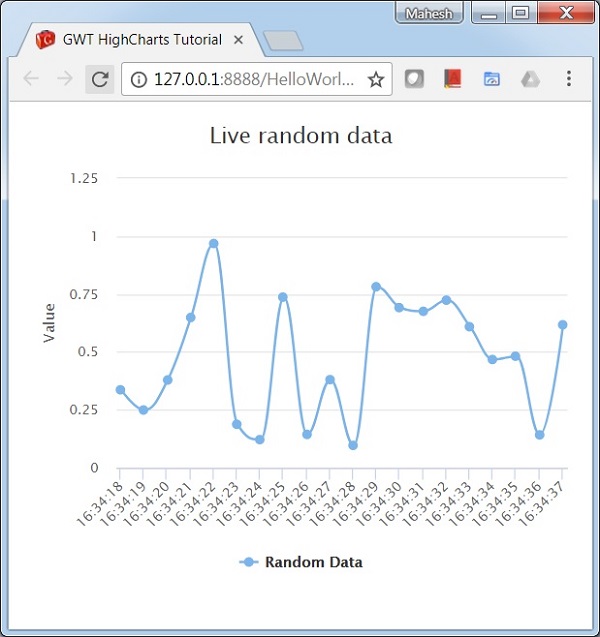
曲線每秒更新
我們在 Highcharts 配置語法 一章中已經見到了用於繪製圖表的配置。
下面給出每秒更新的樣條線圖示例。
配置
現在我們來看看採取的附加配置/步驟。
series.addPoint
以 1000 毫秒的間隔向序列圖中新增一個隨機建立的新點。
Timer tempTimer = new Timer() {
   @Override
   public void run() {
      series.addPoint(
         new Date().getTime(),
         Random.nextDouble(),
         true, true, true
      );
   }
};
tempTimer.scheduleRepeating(1000);
示例
HelloWorld.java
package com.tutorialspoint.client;

import java.util.Date;

import org.moxieapps.gwt.highcharts.client.Chart;
import org.moxieapps.gwt.highcharts.client.Credits;
import org.moxieapps.gwt.highcharts.client.Legend;
import org.moxieapps.gwt.highcharts.client.Series;
import org.moxieapps.gwt.highcharts.client.ToolTip;
import org.moxieapps.gwt.highcharts.client.ToolTipData;
import org.moxieapps.gwt.highcharts.client.ToolTipFormatter;
import org.moxieapps.gwt.highcharts.client.Series.Type;
import org.moxieapps.gwt.highcharts.client.labels.DataLabels;
import org.moxieapps.gwt.highcharts.client.plotOptions.BarPlotOptions;

import com.google.gwt.core.client.EntryPoint;
import com.google.gwt.i18n.client.DateTimeFormat;
import com.google.gwt.i18n.client.NumberFormat;
import com.google.gwt.user.client.Random;
import com.google.gwt.user.client.Timer;
import com.google.gwt.user.client.ui.RootPanel;

public class HelloWorld implements EntryPoint {
   public void onModuleLoad() {
      final Chart chart = new Chart()
         .setChartTitleText("Live random data")
         .setType(Type.SPLINE)
         .setMarginRight(10)
         .setBarPlotOptions(new BarPlotOptions()
               .setDataLabels(new DataLabels()
               .setEnabled(true)
            )
         )
         .setLegend(new Legend()
            .setEnabled(true)
         )
         .setCredits(new Credits()
            .setEnabled(false)
         )
         .setToolTip(new ToolTip()
            .setFormatter(new ToolTipFormatter() {
            @Override
            public String format(ToolTipData toolTipData) {
               return "<b>" + toolTipData.getSeriesName() + "</b><br/>" +
               DateTimeFormat.getFormat("yyyy-MM-dd HH:mm:ss")
               .format(new Date(toolTipData.getXAsLong())) + "<br/>" +
               NumberFormat.getFormat("0.00").format(toolTipData.getYAsDouble());
            }
         })
      );

      chart.getXAxis()
         .setType(org.moxieapps.gwt.highcharts.client.Axis.Type.DATE_TIME)
         .setTickInterval(150);

      chart.getYAxis()
         .setAxisTitleText("Value")
         .setPlotLines(chart.getYAxis().createPlotLine()
            .setValue(0)
            .setWidth(1)
            .setColor("#808080")
         );

      final Series series = chart.createSeries();
      series.setName("Random Data");
      chart.addSeries(series);

      // Generate an array of random data
      long time = new Date().getTime();
      for(int i = -19; i <= 0; i++) {
         series.addPoint(time + i * 1000, Random.nextDouble());
      }

      Timer tempTimer = new Timer() {
         @Override
         public void run() {
            series.addPoint(
               new Date().getTime(),
               Random.nextDouble(),
               true, true, true
            );
         }
      };
      tempTimer.scheduleRepeating(1000);

      RootPanel.get().add(chart);
   }
}
結果
驗證結果。
gwt_highcharts_dynamic_charts.htm
廣告