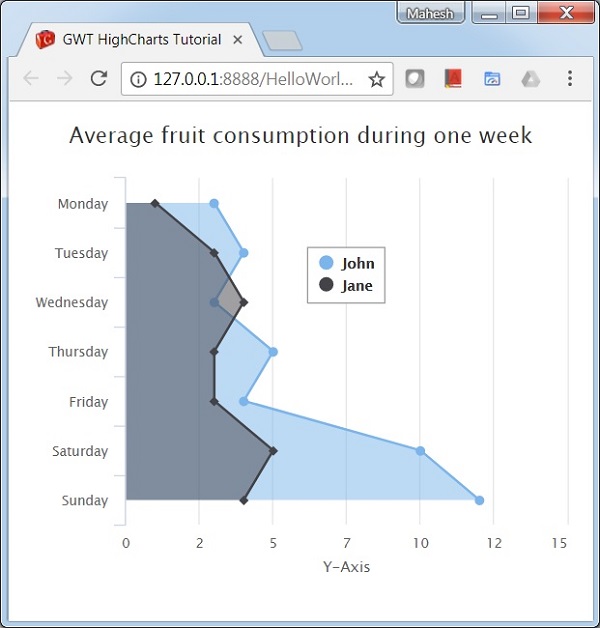
帶有反向值的面積圖
下面是帶有反向值的面積圖示例。
我們已經在 高圖配置語法 章節中看到了用於在圖表中繪製直方圖的配置。現在,讓我們來看帶有反向軸的面積圖示例。我們還將理解附加配置並在圖表中新增反向屬性。
圖表
將圖表的反向配置為 true。
將軸配置為反向。當為真時,x 軸為垂直軸,y 軸為水平軸。如果圖表中存在柱狀系列,則會將該系列反向。在此處,預設值為 false。
chart.setInverted(true)
示例
HelloWorld.java
package com.tutorialspoint.client;

import org.moxieapps.gwt.highcharts.client.Chart;
import org.moxieapps.gwt.highcharts.client.ChartSubtitle;
import org.moxieapps.gwt.highcharts.client.Credits;
import org.moxieapps.gwt.highcharts.client.Legend;
import org.moxieapps.gwt.highcharts.client.Series.Type;
import org.moxieapps.gwt.highcharts.client.Style;

import org.moxieapps.gwt.highcharts.client.ToolTip;
import org.moxieapps.gwt.highcharts.client.ToolTipData;
import org.moxieapps.gwt.highcharts.client.ToolTipFormatter;

import org.moxieapps.gwt.highcharts.client.labels.AxisLabelsData;
import org.moxieapps.gwt.highcharts.client.labels.AxisLabelsFormatter;
import org.moxieapps.gwt.highcharts.client.labels.YAxisLabels;
import org.moxieapps.gwt.highcharts.client.plotOptions.AreaPlotOptions;

import com.google.gwt.core.client.EntryPoint;
import com.google.gwt.user.client.ui.RootPanel;

public class HelloWorld implements EntryPoint {
   public void onModuleLoad() {
      Chart chart = new Chart()
         .setType(Type.AREA)
         .setInverted(true)
         .setChartTitleText("Average fruit consumption during one week")
         .setChartSubtitle(new ChartSubtitle()
            .setStyle(new Style()
               .setPosition("absolute")
               .setRight("0px")
               .setBottom("0px")
            )
         )
         .setLegend(new Legend()
            .setLayout(Legend.Layout.VERTICAL)
            .setAlign(Legend.Align.RIGHT)
            .setVerticalAlign(Legend.VerticalAlign.TOP)
            .setX(-150)
            .setY(100)
            .setFloating(true)
            .setBorderWidth(1)
            .setBackgroundColor("#FFFFFF")
         )
         .setToolTip(new ToolTip()
            .setFormatter(
               new ToolTipFormatter() {
                  public String format(ToolTipData toolTipData) {
                     return "<b>" + toolTipData.getSeriesName() + "</b><br/>" +
                        toolTipData.getXAsString() + ": " + toolTipData.getYAsLong();
                  }
               }
            )
         )
         .setCredits(new Credits()
            .setEnabled(false)
         )
         .setAreaPlotOptions(new AreaPlotOptions()
            .setFillOpacity(0.5)
         );

         chart.getXAxis()
            .setCategories(
               "Monday",  "Tuesday", "Wednesday", "Thursday", "Friday", "Saturday", "Sunday"
            );

         chart.getYAxis()
            .setAxisTitleText("Y-Axis")
            .setLabels(new YAxisLabels()
            .setFormatter(new AxisLabelsFormatter() {
               public String format(AxisLabelsData axisLabelsData) {
                  return String.valueOf(axisLabelsData.getValueAsLong());
               }
            })
         );

         chart.addSeries(chart.createSeries()
            .setName("John")
            .setPoints(new Number[] {3, 4, 3, 5, 4, 10, 12})
         );
         chart.addSeries(chart.createSeries()
            .setName("Jane")
            .setPoints(new Number[] {1, 3, 4, 3, 3, 5, 4})
         );
      RootPanel.get().add(chart);
   }
}
結果
驗證結果。
gwt_highcharts_area_charts.htm
廣告