- GWT Highcharts 教程
- GWT Highcharts - 主頁
- GWT Highcharts - 概覽
- 環境設定
- 配置語法
- GWT Highcharts - 折線圖
- GWT Highcharts - 面積圖
- GWT Highcharts - 條形圖
- GWT Highcharts - 柱狀圖
- GWT Highcharts - 餅圖
- GWT Highcharts - 散點圖
- GWT Highcharts - 動態圖表
- GWT Highcharts - 組合圖表
- GWT Highcharts - 3D 圖表
- GWT Highcharts - 地圖圖表
- GWT Highcharts 有用資源
- GWT Highcharts - 快速指南
- GWT Highcharts - 有用資源
- GWT Highcharts - 討論
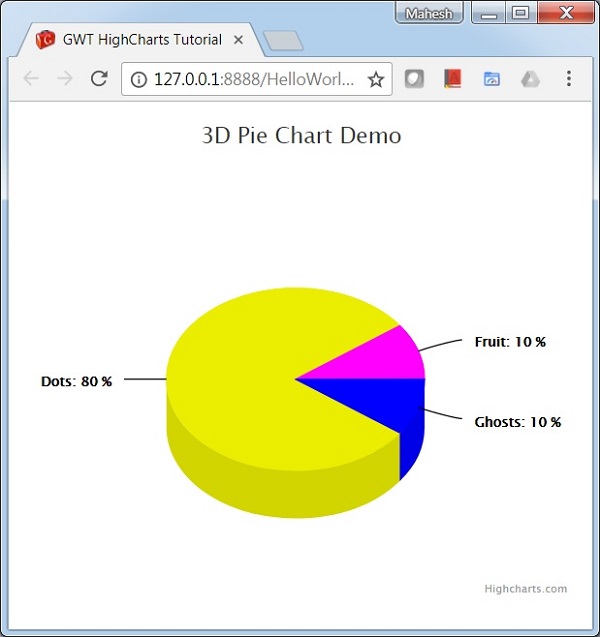
GWT Highcharts - 3D 餅圖
以下是 3D 餅圖的一個示例。
我們已經在 Highcharts 配置語法 一章中瞭解了用於繪製圖表的配置。
下面給出了 3D 餅圖的一個示例。
配置
下面我們來看看其他配置/執行的步驟。
option3D
將餅圖型別配置為基於 3D。Options3D 設定啟用了 3D 選項。
chart.setOptions3D(new Options3D()
   .setEnabled(true)
   .setAlpha(45)
   .setBeta(0)
   .setDepth(100)
)
示例
HelloWorld.java
package com.tutorialspoint.client;

import org.moxieapps.gwt.highcharts.client.Chart;
import org.moxieapps.gwt.highcharts.client.Legend;
import org.moxieapps.gwt.highcharts.client.Options3D;
import org.moxieapps.gwt.highcharts.client.Point;
import org.moxieapps.gwt.highcharts.client.Series;
import org.moxieapps.gwt.highcharts.client.ToolTip;
import org.moxieapps.gwt.highcharts.client.ToolTipData;
import org.moxieapps.gwt.highcharts.client.ToolTipFormatter;

import org.moxieapps.gwt.highcharts.client.labels.DataLabelsData;
import org.moxieapps.gwt.highcharts.client.labels.DataLabelsFormatter;
import org.moxieapps.gwt.highcharts.client.labels.PieDataLabels;

import org.moxieapps.gwt.highcharts.client.plotOptions.PiePlotOptions;
import org.moxieapps.gwt.highcharts.client.plotOptions.PlotOptions.Cursor;

import com.google.gwt.core.client.EntryPoint;
import com.google.gwt.user.client.ui.RootPanel;

public class HelloWorld implements EntryPoint {
   public void onModuleLoad() {
      final Chart chart = new Chart()
         .setType(Series.Type.PIE)
         .setChartTitleText("3D Pie Chart Demo")
         .setPlotBackgroundColor((String) null)
         .setPlotBorderWidth(null)
         .setPlotShadow(false)
         .setPiePlotOptions(new PiePlotOptions()
            .setAllowPointSelect(true)
            .setCursor(Cursor.POINTER)
            .setPieDataLabels(new PieDataLabels()
               .setConnectorColor("#000000")
               .setEnabled(true)
               .setColor("#000000")
               .setFormatter(new DataLabelsFormatter() {
                  @Override
                  public String format(DataLabelsData dataLabelsData) {
                     return "<b>" + dataLabelsData.getPointName() + "</b>: " + dataLabelsData.getYAsDouble() + " %";
                  }
               })
            )
            .setStartAngle(126)
            .setDepth(75)
         )
         .setLegend(new Legend()
            .setLayout(Legend.Layout.VERTICAL)
            .setAlign(Legend.Align.RIGHT)
            .setVerticalAlign(Legend.VerticalAlign.TOP)
            .setX(-100)
            .setY(100)
            .setFloating(true)
            .setBorderWidth(1)
            .setBackgroundColor("#FFFFFF")
            .setShadow(true)
         )
         .setToolTip(new ToolTip()
            .setFormatter(new ToolTipFormatter() {
               @Override
               public String format(ToolTipData toolTipData) {
                  return "" + toolTipData.getPointName() + ": " + toolTipData.getYAsDouble() + " %";
               }
            }))
            .setColors("#EBEE00", "#FF00FF", "#0000FF")
            .setOptions3D(new Options3D()
               .setEnabled(true)
               .setAlpha(45)
               .setBeta(0)
               .setDepth(100)
            );

         chart.addSeries(chart.createSeries()
            .setName("Browser share")
            .setPoints(new Point[]{
               new Point("Dots", 80.0),
               new Point("Fruit", 10.0),
               new Point("Ghosts", 10.0)
            })
         );

      RootPanel.get().add(chart);
   }
}
結果
驗證結果。
gwt_highcharts_3d_charts.htm
廣告