
 資料結構
資料結構 網路
網路 關係資料庫管理系統 (RDBMS)
 作業系統
作業系統 Java
Java iOS
iOS HTML
HTML CSS
CSS Android
 Python
 C 程式設計
 C++
C++ C#
C# MongoDB
 MySQL
MySQL Javascript
 PHP
PHPMATLAB 中的三次樣條資料插值
在數學中,三次樣條資料插值是一種計算給定資料集資料點之間值的方法。當我們想要繪製一條穿過這些資料點的平滑曲線時,這種技術被廣泛使用。
在 MATLAB 中,我們可以使用兩個內建函式中的任何一個來計算三次樣條資料插值,即 'spline' 或 'interp1'。
語法
其中,'spline' 函式的語法為:
I = spline(x, y, query);
這裡,'x' 和 'y' 是包含用於插值的輸入資料點的向量,而 'query' 是包含我們要執行插值的資料點的向量。
'interp1' 函式的語法為:
I = interp1(x, y, query, 'spline');
在 'interp1' 函式中,我們使用 'spline' 選項來指定要對輸入資料執行的操作。
如何使用 MATLAB 執行三次樣條資料插值?
這裡解釋了對給定資料集點執行三次樣條資料插值的逐步過程。
步驟 (1) - 定義要執行插值的資料點。
步驟 (2) - 指定包含我們要執行三次樣條插值的資料點的查詢。
步驟 (3) - 計算提供的輸入資料點的三次樣條資料插值。
步驟 (4) - 顯示插值結果。
步驟 (5) - 繪製三次樣條資料插值的結果。
現在讓我們從實踐上了解如何使用 MATLAB 計算三次樣條資料插值。
以下 MATLAB 程式演示了對一組給定資料點進行三次樣條插值的計算。
(1). 使用 'spline' 函式進行三次樣條插值
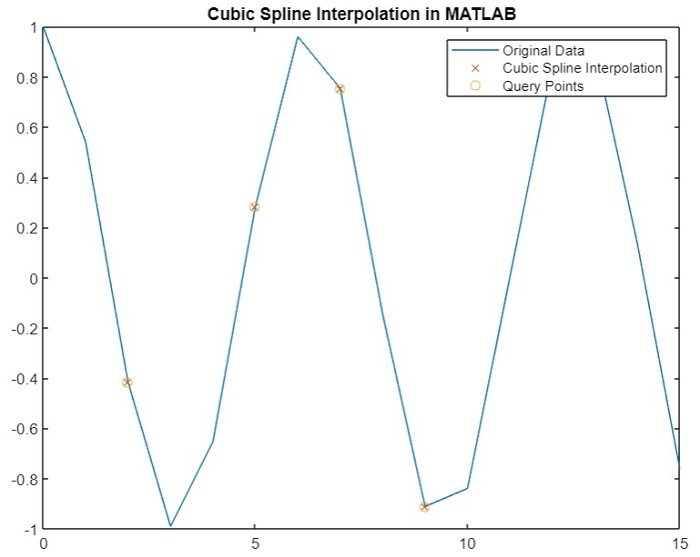
以下 MATLAB 程式顯示瞭如何使用 'spline' 函式來計算給定資料的三次樣條插值。
MATLAB 程式 (1)
% MATLAB program to calculate cubic spline data interpolation using 'spline' function
% Define sample data points
x = 0:15;
y = cos(x);

% Specify the query containing the data points to perform interpolation
query = [2, 5, 7, 9];

% Calculate the cubic spline interpolation
I = spline(x, y, query);

% Display the results of interpolation
disp('Query Points   Interpolation Results');
disp([query' I']);

% Plot curves for original data and interpolated results
figure;
plot(x, y, '-', query, I, 'x', query, I, 'o');
title('Cubic Spline Interpolation in MATLAB');
輸出
Query Points   Interpolation Results
    2.0000   -0.4161
    5.0000    0.2837
    7.0000    0.7539
    9.0000   -0.9111
您將獲得以下圖 -
(2). 使用 'interp1' 函式進行三次樣條插值
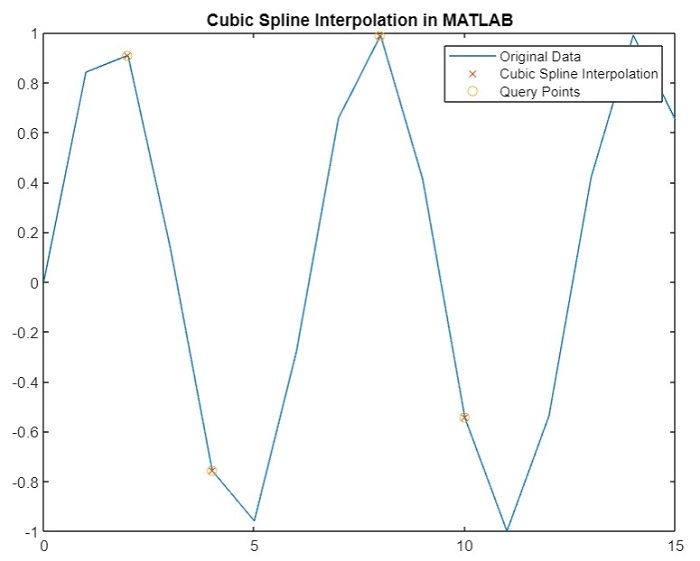
如上所述,我們還可以使用 'interp1' 函式計算給定資料集的三次樣條插值。以下 MATLAB 程式說明了使用 'interp1' 函式計算三次樣條插值的程式碼實現。
Matlab 示例 (2)
% MATLAB program to calculate cubic spline data interpolation using 'interp1' function
% Define sample data points
x = 0:15;
y = sin(x);

% Specify the query containing the data points to perform interpolation
query = [2, 4, 8, 10];

% Calculate the cubic spline interpolation
I = interp1(x, y, query, 'spline');

% Display the results of interpolation
disp('Query Points   Interpolation Results');
disp([query' I']);

% Plot curves for original data and interpolated results
figure;
plot(x, y, '-', query, I, 'x', query, I, 'o');
legend('Original Data', 'Cubic Spline Interpolation', 'Query Points');
title('Cubic Spline Interpolation in MATLAB');
輸出
Query Points   Interpolation Results
    2.0000    0.9093
    4.0000   -0.7568
    8.0000    0.9894
   10.0000   -0.5440
您將獲得以下圖 -
結論
這就是關於使用 MATLAB 計算三次樣條資料插值的所有內容。在本教程中,我們描述了三次樣條資料插值以及使用 MATLAB 計算它的步驟。此外,我們還透過示例 MATLAB 程式演示了使用 MATLAB 計算三次樣條資料插值,以便更好地理解。

269 次檢視
