- Apache Bench 教程
- Apache Bench - 首頁
- Apache Bench - 概述
- Apache Bench - 環境設定
- 測試我們的示例應用程式
- 併發測試多個 URL
- 動態頁面測試準備
- 動態頁面的順序測試用例
- 輸出結果比較
- Apache Bench 有用資源
- Apache Bench - 快速指南
- Apache Bench - 有用資源
- Apache Bench - 討論
Apache Bench - 快速指南
Apache Bench - 概述
效能測試已被證明對業務成功至關重要。糟糕的網站效能不僅會導致經濟損失,有時還會導致法律後果。
在重要的線上互動中,例如購物、線上考試、賬單支付等,沒有人願意忍受緩慢且不可靠的網站。隨著網際網路的廣泛普及,替代方案的數量非常龐大。失去客戶比獲得客戶更容易,而效能是關鍵的變革因素。
負載測試工具的必要性
如果我們能理解負載測試工具的必要性,它將給我們使用它的理由和動力。一些著名的商業網站在訪問量激增時遭受了嚴重的停機。電子商務網站在廣告活動上投入巨資,但在負載測試上卻很少投入。因此,當這些營銷活動帶來流量時,他們無法確保最佳的系統性能。
另一個忽略負載測試的常見例子是 WordPress 網站中出現的“建立連線錯誤”。因此,在將網站或應用程式部署到生產環境之前,對其進行負載測試是一個好主意。在進行更詳細的測試之前,快速建立專案的最佳情況場景會很好。
什麼是 Apache Bench?
Apache Bench (ab) 是 Apache 組織提供的一個用於對超文字傳輸協議 (HTTP) web 伺服器進行基準測試的工具。雖然它旨在衡量 Apache web 伺服器的效能,但它也可以用於測試任何其他同樣優秀的 web 伺服器。使用此工具,您可以快速瞭解您的 web 伺服器能夠處理每秒多少個請求。
Apache Bench 的特性
讓我們看看 Apache Bench 的重要特性和限制。特性和限制如下所示:
作為開源軟體,它是免費提供的。
它是一個簡單的命令列計算機程式。
它是一個平臺無關的工具。這意味著它可以在 Linux/Unix 或 Windows 伺服器上同樣有效地呼叫。
它只能對 web 伺服器(HTTP 或 HTTPS)進行負載和效能測試。
它不可擴充套件。
Apache Bench 無論併發級別(由 -c 標誌指定)如何,都只使用一個作業系統執行緒。因此,在對高容量伺服器進行基準測試時,Apache Bench 的單個例項本身可能成為瓶頸。要完全飽和目標 URL,如果您的伺服器有多個處理器核心,最好並行使用 Apache Bench 的其他例項。
注意事項
您需要注意的是,在 Apache Bench 中沒有指令可以在執行測試時以特定間隔增加併發性。因此,使用 ab 執行負載測試等同於拒絕服務 (DOS) 攻擊。如果您要長時間進行大量的負載測試,建議您告知並事先獲得您的 VPS 服務提供商的許可。他們會為您分配合適的時間間隔或將您的節點轉移到負載測試任務上。
其次,如果您只是為了學習 Apache Bench 而持續且長時間地測試第三方的網站(您的 VPS 成為測試節點),則存在您的 VPS 公共 IP 被第三方網站永久阻止的可能性。在這種情況下,您將無法使用相同的 IP 連線到該網站。但是,如果您確實希望將來連線到該網站,唯一的解決方案是與目標網站的系統管理員聯絡,或在 VPS 服務提供商的幫助下建立具有不同 IP 的伺服器的新例項。
在警告您之後,請讓我向您保證,本教程中的所有測試都足夠安全,並且不屬於系統管理員通常所說的“系統濫用”行為。
Apache Bench - 環境設定
在本章中,我們將指導您如何在您的 VPS 上為 Apache Bench 設定環境。
系統要求
記憶體 - 128 MB
磁碟空間 - 沒有最低要求
作業系統 - 沒有最低要求
安裝 Apache Bench
Apache Bench 是一個獨立的應用程式,不依賴於 Apache web 伺服器的安裝。以下是安裝 Apache Bench 的兩步過程。
步驟 1 - 更新軟體包資料庫。
# apt-get update
請注意,終端命令之前的符號 # 表示 root 使用者正在發出該命令。
步驟 2 - 安裝 apache2 utils 軟體包以訪問 Apache Bench。
# apt-get install apache2-utils
Apache Bench 現在已安裝。如果您想測試託管在同一 VPS 上的 web 應用程式,那麼只需安裝 Apache web 伺服器即可:
# apt-get install apache2
作為 Apache 實用程式,Apache Bench 會在安裝 Apache web 伺服器時自動安裝。
驗證 Apache Bench 安裝
現在讓我們看看如何驗證 Apache Bench 的安裝。以下程式碼將幫助您驗證安裝:
# ab -V
輸出
This is ApacheBench, Version 2.3 <$Revision: 1604373 $>
Copyright 1996 Adam Twiss, Zeus Technology Ltd, http://www.zeustech.net/
Licensed to The Apache Software Foundation, http://www.apache.org/
當您看到上述終端輸出時,表示您已成功安裝 Apache Bench。
建立特權 Sudo 使用者
從安全形度來看,對於系統管理員來說,建立 sudo 使用者而不是以 root 使用者身份工作被認為是一種良好的實踐。我們將建立一個名為 test 的測試使用者,用於此目的:
# useradd -m -d /home/test -g sudo test
讓我們為新使用者設定密碼:
# passwd test
系統將提示您為使用者 test 輸入新密碼。您可以輸入一個簡單的密碼,因為我們只是在測試,而不是部署到生產伺服器。通常,sudo 命令會提示您提供 sudo 使用者密碼;建議不要使用複雜密碼,因為此過程會變得麻煩。
輸出
Enter new UNIX password:
Retype new UNIX password:
passwd: password updated successfully
測試 Apache.org 網站
在本節中,我們將測試 Apache.org 網站。讓我們首先切換到 sudo 使用者 test:
# su test
首先,我們將測試 Apache 組織的網站,https://www.apache.org/。我們將首先執行命令,然後理解輸出:
$ ab -n 100 -c 10 https://www.apache.org/
這裡-n是為基準測試會話執行的請求數。預設情況下只執行單個請求,這通常會導致基準測試結果不具有代表性。
而-c是併發性,表示一次執行多個請求的數量。預設情況下一次一個請求。
因此,在此測試中,Apache Bench 將以 10 的併發性向 Apache 組織伺服器發出 100 個請求。
輸出
This is ApacheBench, Version 2.3 <$Revision: 1604373 $>
Copyright 1996 Adam Twiss, Zeus Technology Ltd, http://www.zeustech.net/
Licensed to The Apache Software Foundation, http://www.apache.org/

Benchmarking www.apache.org (be patient).....done

Server Software:        Apache/2.4.7
Server Hostname:        www.apache.org
Server Port:            443
SSL/TLS Protocol:       TLSv1.2,ECDHE-RSA-AES256-GCM-SHA384,2048,256

Document Path:          /
Document Length:        58769 bytes

Concurrency Level:      10
Time taken for tests:   1.004 seconds
Complete requests:      100
Failed requests:        0
Total transferred:      5911100 bytes
HTML transferred:       5876900 bytes
Requests per second:    99.56 [#/sec] (mean)
Time per request:       100.444 [ms] (mean)
Time per request:       10.044 [ms] (mean, across all concurrent requests)
Transfer rate:          5747.06 [Kbytes/sec] received

Connection Times (ms)
              min  mean[+/-sd] median   max
Connect:       39   46  30.9     41     263
Processing:    37   40  21.7     38     255
Waiting:       12   15  21.7     13     230
Total:         77   86  37.5     79     301

Percentage of the requests served within a certain time (ms)
  50%     79
  66%     79
  75%     80
  80%     80
  90%     82
  95%     84
  98%    296
  99%    301
 100%    301 (longest request)
執行我們的第一個測試後,很容易識別此命令的使用模式,如下所示:
# ab [options .....] URL
其中,
ab - Apache Bench 命令
options - 我們要執行的特定任務的標誌
URL - 我們要測試的路徑 URL
理解輸出值
我們需要理解不同的指標來理解 ab 返回的各種輸出值。以下是列表:
伺服器軟體 - 這是在第一個成功返回的 HTTP 標頭中返回的 web 伺服器名稱。
伺服器主機名 - 這是命令列上給定的 DNS 或 IP 地址。
伺服器埠 - 這是 ab 連線到的埠。如果命令列上沒有給出埠,則預設為 http 的 80 和 https 的 443。
SSL/TLS 協議 - 這是客戶端和伺服器之間協商的協議引數。只有在使用 SSL 時才會列印此內容。
文件路徑 - 這是從命令列字串解析的請求 URI。
文件長度 - 這是第一個成功返回的文件的大小(以位元組為單位)。如果文件長度在測試期間發生變化,則響應被視為錯誤。
併發級別 - 這是測試期間使用的併發客戶端(相當於 web 瀏覽器)的數量。
測試花費的時間 - 這是從建立第一個套接字連線到接收最後一個響應所花費的時間。
完成的請求 - 收到的成功響應的數量。
失敗的請求 - 被視為失敗的請求數量。如果此數字大於零,則會列印另一行,顯示由於連線、讀取、內容長度不正確或異常而失敗的請求數量。
總傳輸量 - 從伺服器接收到的位元組總數。此數字本質上是從網路上傳輸的位元組數。
HTML 傳輸量 - 從伺服器接收到的文件位元組總數。此數字不包括在 HTTP 標頭中接收到的位元組。
每秒請求數 - 這是每秒的請求數。此值是將請求數除以總花費時間的結果。
每個請求的時間 - 平均每個請求花費的時間。第一個值是使用公式併發性 * 時間 * 1000 / 完成計算,而第二個值是使用公式時間 * 1000 / 完成計算。
傳輸速率 - 使用公式總讀取 / 1024 / 時間計算的傳輸速率。
負載測試輸出的快速分析
在瞭解了 ab 命令輸出值的標題後,讓我們嘗試分析和理解我們初始測試的輸出值:
Apache 組織正在使用他們自己的 Web 伺服器軟體 - Apache(版本 2.4.7)
由於 https,伺服器正在埠 443 上監聽。如果是 http,它將是 80(預設)。
100 個請求總共傳輸了 58769 位元組資料。
測試在 1.004 秒內完成。沒有失敗的請求。
每秒請求數 - 99.56。這被認為是一個相當不錯的數字。
每個請求的時間 - 100.444 毫秒(對於 10 個併發請求)。因此,在所有請求中,它是 100.444 毫秒 / 10 = 10.044 毫秒。
傳輸速率 - 接收到的 1338.39 [千位元組/秒]。
在連線時間統計中,您可以觀察到許多請求必須等待幾秒鐘。這可能是由於 apache web 伺服器將請求放入等待佇列。
在我們的第一個測試中,我們測試了一個託管在不同伺服器上的應用程式(即 www.apache.org)。在本教程的後面部分,我們將測試託管在與執行 ab 測試相同的伺服器上的示例 web 應用程式。這是為了便於學習和演示。理想情況下,主機節點和測試節點應該不同,以便進行準確的測量。
為了更好地學習 ab,您應該比較和觀察輸出值在不同情況下如何變化,因為我們將在本教程中繼續學習。
繪製 Apache Bench 的輸出
這裡我們將繪製相關的結果,以檢視伺服器在請求數量增加時需要花費多少時間。為此,我們將在之前的命令中新增-g選項,後跟檔名(這裡為out.data),其中將儲存ab輸出資料:
$ ab -n 100 -c 10 -g out.data https://www.apache.org/
現在讓我們在建立圖表之前檢視out.data:
$ less out.data
輸出
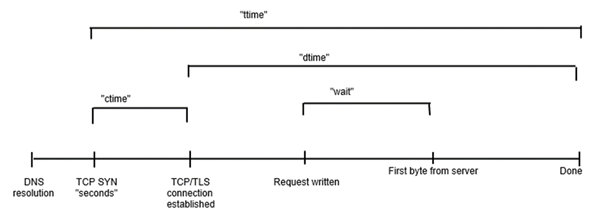
starttime       seconds ctime   dtime   ttime   wait
Tue May 30 12:11:37 2017        1496160697      40      38      77      13
Tue May 30 12:11:37 2017        1496160697      42      38      79      13
Tue May 30 12:11:37 2017        1496160697      41      38      80      13
...
現在讓我們瞭解out.data檔案中的列標題:
starttime - 這是呼叫開始的日期和時間。
seconds - 與starttime相同,但使用Unix時間戳格式(date -d @1496160697返回starttime輸出)。
ctime - 這是連線時間。
dtime - 這是處理時間。
ttime - 這是總時間(它是ctime和dtime的總和,在數學上ttime = ctime + dtime)。
wait - 這是等待時間。
要直觀地瞭解這些多個專案之間是如何相互關聯的,請檢視以下圖片:
如果我們在終端或圖形不可用的環境中工作,gnuplot是一個不錯的選擇。我們將透過以下步驟快速瞭解它。
讓我們安裝並啟動gnuplot:
$ sudo apt-get install gnuplot
$ gnuplot
輸出
G N U P L O T
Version 4.6 patchlevel 6    last modified September 2014
Build System: Linux x86_64

Copyright (C) 1986-1993, 1998, 2004, 2007-2014
Thomas Williams, Colin Kelley and many others

gnuplot home:     http://www.gnuplot.info
faq, bugs, etc:   type "help FAQ"
immediate help:   type "help"  (plot window: hit 'h')

Terminal type set to 'qt'
gnuplot>
由於我們正在終端上工作,並且假設圖形不可用,我們可以選擇啞終端,它將在終端本身輸出ASCII字元。這有助於我們瞭解此快速工具的繪圖效果。現在讓我們準備終端以進行ASCII繪圖。
gnuplot> set terminal dumb
輸出
Terminal type set to 'dumb'
Options are 'feed  size 79, 24'
現在,我們的gnuplot終端已準備好進行ASCII繪圖,讓我們繪製out.data檔案中的資料:
gnuplot> plot "out.data" using 9 w l
輸出
  1400 ++-----+------+-----+------+------+------+------+-----+------+-----++
       +      +      +     +      +      +      +"out.data" using 9 ****** +
       |                                                                   |
  1200 ++                       ********************************************
       |     *******************                                           |
  1000 ++    *                                                            ++
       |     *                                                             |
       |     *                                                             |
   800 ++   *                                                             ++
       |    *                                                              |
       |    *                                                              |
   600 ++   *                                                             ++
       |    *                                                              |
       |    *                                                              |
   400 ++   *                                                             ++
       |    *                                                              |
   200 ++   *                                                             ++
       |    *                                                              |
       +****  +      +     +      +      +      +      +     +      +      +
     0 ++-----+------+-----+------+------+------+------+-----+------+-----++
       0      10     20    30     40     50     60     70    80     90    100
我們繪製了ttime,即第9列中的總時間(以毫秒為單位),相對於請求數量。我們可以注意到,對於最初的十個請求,總時間接近100毫秒,對於接下來的30個請求(從第10個到第40個),它增加到1100毫秒,依此類推。您的圖表根據您的out.data可能會有所不同。
測試我們的示例應用程式
在上一章中,我們瞭解了Apache Bench測試第三方網站的基本用法。在本節中,我們將使用此工具測試我們自己的伺服器上的Web應用程式。為了使教程儘可能地自包含,我們選擇安裝一個Python應用程式進行演示;您可以根據自己的專業水平選擇其他語言,如PHP或Ruby。
安裝Python
通常,Python在Linux伺服器上預設安裝。
安裝Bottle框架並建立簡單的應用程式
Bottle是一個用Python編寫的微框架,用於建立Web應用程式,pip是Python包管理器。在終端中鍵入以下命令以安裝Bottle:
$ sudo apt-get install python-pip
$ sudo pip install bottle
現在讓我們建立一個小的Bottle應用程式。為此,建立一個目錄並進入其中:
$ mkdir webapp
$ cd webapp
我們將在webapp目錄中建立一個新的Python指令碼app.py:
$ vim app.py
現在,在app.py檔案中編寫以下程式碼:
from bottle import Bottle, run

app = Bottle()

@app.route('/')
@app.route('/hello')
def hello():
   return "Hello World!"

run(app, host = 'localhost', port = 8080)
新增上述行後,儲存並關閉檔案。儲存檔案後,我們可以執行Python指令碼以啟動應用程式:
$ python app.py
輸出
Bottle v0.12.7 server starting up (using WSGIRefServer())...
Listening on https://:8080/
Hit Ctrl-C to quit.
此輸出表明我們的應用程式正在本地機器上的主機https://上執行,並在埠8080上監聽。
讓我們檢查我們的應用程式是否正確響應HTTP請求。由於此終端在不退出Bottle應用程式服務的情況下無法接收任何輸入,因此我們需要使用另一個終端登入到我們的VPS。使用另一個終端登入到VPS後,您可以透過在新的終端中鍵入以下程式碼來導航到您的應用程式。
$ lynx https://:8080/
Lynx是一個命令列瀏覽器,通常在各種Linux發行版(如Debian和Ubuntu)中預設安裝。如果您看到以下輸出,則表示您的應用程式執行正常。
輸出
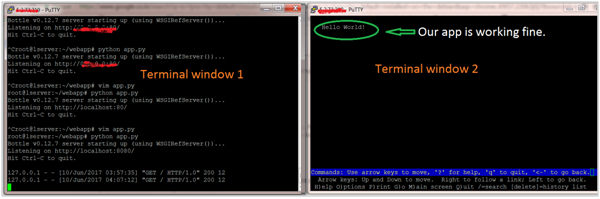
如果您看到以上輸出,則表示我們的應用程式已上線並準備進行測試。
使用開發Web伺服器測試應用程式
請注意,ab中存在一個錯誤,它無法測試localhost上的應用程式。因此,我們將在app.py檔案中將主機從localhost更改為127.0.0.1。因此,檔案將更改為以下內容:
from bottle import Bottle, run

app = Bottle()

@app.route('/')
@app.route('/hello')
def hello():
   return "Hello World!"

run(app, host = '127.0.0.1', port = 8080)
現在讓我們透過在執行lynx命令的同一終端上鍵入以下命令來測試我們的應用程式:
$ ab -n 100 -c 10 http://127.0.0.1:8080/hello
輸出
This is ApacheBench, Version 2.3 <$Revision: 1604373 $>
Copyright 1996 Adam Twiss, Zeus Technology Ltd, http://www.zeustech.net/
Licensed to The Apache Software Foundation, http://www.apache.org/

Benchmarking 127.0.0.1 (be patient).....done


Server Software:        WSGIServer/0.1
Server Hostname:        127.0.0.1
Server Port:            8080

Document Path:          /hello
Document Length:        12 bytes

Concurrency Level:      10
Time taken for tests:   0.203 seconds
Complete requests:      100
Failed requests:        0
Total transferred:      16500 bytes
HTML transferred:       1200 bytes
Requests per second:    493.78 [#/sec] (mean)
Time per request:       20.252 [ms] (mean)
Time per request:       2.025 [ms] (mean, across all concurrent requests)
Transfer rate:          79.56 [Kbytes/sec] received

Connection Times (ms)
              min  mean[+/-sd] median   max
Connect:        0    0   0.1      0       0
Processing:     1    6  28.2      2     202
Waiting:        1    6  28.2      2     202
Total:          1    6  28.2      2     202

Percentage of the requests served within a certain time (ms)
  50%      2
  66%      2
  75%      2
  80%      2
  90%      2
  95%      2
  98%    202
  99%    202
 100%    202 (longest request)
而第一個終端上的輸出將是(100次)如下:
...
127.0.0.1 - - [10/Jun/2017 04:30:26] "GET /hello HTTP/1.0" 200 12
127.0.0.1 - - [10/Jun/2017 04:30:26] "GET /hello HTTP/1.0" 200 12
127.0.0.1 - - [10/Jun/2017 04:30:26] "GET /hello HTTP/1.0" 200 12
...
您可以觀察到與初始測試相比,ab結果的各種值是如何變化的。
使用多執行緒Web伺服器測試應用程式
在ab的先前測試中,我們使用了Bottle框架中捆綁的預設Web伺服器。
現在,我們將使用多執行緒Web伺服器替換單執行緒預設Web伺服器。因此,讓我們安裝一個多執行緒Web伺服器庫,如cherrypy或gunicorn,並告訴Bottle使用它。我們在這裡選擇了gunicorn進行演示(您也可以選擇其他一些):
$ sudo apt-get install gunicorn
並修改檔案,即從預設Web伺服器更改為gunicorn:
...
run(server = 'gunicorn'...)
...
讓我們在第二個終端中測試應用程式。
$ ab -n 100 -c 10 http://127.0.0.1:8080/hello
輸出
This is ApacheBench, Version 2.3 <$Revision: 1604373 $>
Copyright 1996 Adam Twiss, Zeus Technology Ltd, http://www.zeustech.net/
Licensed to The Apache Software Foundation, http://www.apache.org/

Benchmarking 127.0.0.1 (be patient).....done


Server Software:        gunicorn/19.0.0
Server Hostname:        127.0.0.1
Server Port:            8080

Document Path:          /hello
Document Length:        12 bytes

Concurrency Level:      10
Time taken for tests:   0.031 seconds
Complete requests:      100
Failed requests:        0
Total transferred:      17200 bytes
HTML transferred:       1200 bytes
Requests per second:    3252.77 [#/sec] (mean)
Time per request:       3.074 [ms] (mean)
Time per request:       0.307 [ms] (mean, across all concurrent requests)
Transfer rate:          546.36 [Kbytes/sec] received

Connection Times (ms)
              min  mean[+/-sd] median   max
Connect:        0    1   0.9      0       4
Processing:     1    2   0.7      3       4
Waiting:        0    2   0.8      2       3
Total:          2    3   0.6      3       5
WARNING: The median and mean for the initial connection time are not within a normal
        deviation These results are probably not that reliable.
WARNING: The median and mean for the processing time are not within a normal deviation
        These results are probably not that reliable.

Percentage of the requests served within a certain time (ms)
  50%      3
  66%      3
  75%      3
  80%      3
  90%      4
  95%      5
  98%      5
  99%      5
 100%      5 (longest request)
觀察每秒請求數如何從493增加到3252。這意味著gunicorn適合用作Python應用程式的生產伺服器。
併發測試多個 URL
在本章中,我們將學習如何同時測試多個URL。為此,我們需要編輯應用程式檔案app.py以包含兩個URL:
from bottle import Bottle, run

app = Bottle()

@app.route('/')
@app.route('/hello1')
def hello():
   return "Hello World! It is first URL."

@app.route('/hello2')
def hello():
   return "Hello World! It is second URL."

run(app,server = 'gunicorn',host = '127.0.0.1', port = 8080)
建立簡單的Shell指令碼
您可以透過建立具有多個ab呼叫的Shell指令碼來實現此目的。建立檔案test.sh並在其中新增以下行:
ab -n 100 -c 10 http://127.0.0.1:8080/hello1
ab -n 100 -c 10 http://127.0.0.1:8080/hello2
新增上述行後,儲存並關閉檔案。使檔案可執行:
chmod u+x test.sh
現在讓我們執行指令碼:
./test.sh
為了避免重複和清晰起見,我們將僅顯示ab輸出的相關部分,並用點表示省略了哪一部分,如下所示。
輸出
.
.
.
Document Path:          /hello1
Document Length:        732 bytes

Concurrency Level:      10
Time taken for tests:   0.040 seconds
Complete requests:      100
Failed requests:        0
Non-2xx responses:      100
Total transferred:      90000 bytes
HTML transferred:       73200 bytes
Requests per second:    2496.13 [#/sec] (mean)
Time per request:       4.006 [ms] (mean)
Time per request:       0.401 [ms] (mean, across all concurrent requests)
Transfer rate:          2193.87 [Kbytes/sec] received

Connection Times (ms)
              min  mean[+/-sd] median   max
Connect:        0    0   0.8      0       3
Processing:     1    3   1.0      4       5
Waiting:        0    3   1.2      4       4
Total:          1    4   0.6      4       5
WARNING: The median and mean for the processing time are not within a normal deviation
        These results are probably not that reliable.
.
.
.
將Apache Bench輸出儲存到檔案的Shell指令碼
您可以透過建立具有多個ab呼叫的Shell指令碼將Apache Bench輸出儲存到檔案。在每一行的末尾放置一個&; 這使得命令在後臺執行,並允許下一個命令開始執行。您還希望使用<filename>將每個URL的輸出重定向到檔案。例如,修改後的檔案test.sh將如下所示:
$ ab -n 100 -c 10 http://127.0.0.1:8080/hello1 > test1.txt &
$ ab -n 100 -c 10 http://127.0.0.1:8080/hello2 > test2.txt &
這裡,test1.txt和test2.txt是儲存輸出資料的檔案。
您可以檢查上述指令碼是否建立了兩個檔案test1.txt和test2.txt,其中包含各個URL的ab輸出:
$ ls -l
輸出
...
-rw-r--r-- 1 root root  5225 May 30 12:11 out.data
-rwxr--r-- 1 root root   118 Jun 10 12:24 test.sh
-rw-r--r-- 1 root root  1291 Jun 10 12:31 test1.txt
-rwxr--r-- 1 root root    91 Jun 10 13:22 test2.sh
-rw-r--r-- 1 root root  1291 Jun 10 12:31 test2.txt
...
注意情況
在使用ab時,您應該注意沒有警告的測試失敗。例如,如果您檢查錯誤的URL,您可能會得到類似以下內容(我們在這裡故意更改了埠)。
$ ab -l -r -n 100 -c 10 -k -H "Accept-Encoding: gzip, deflate" http://127.0.0.1:805/
輸出
This is ApacheBench, Version 2.3 <$Revision: 1604373 $>
Copyright 1996 Adam Twiss, Zeus Technology Ltd, http://www.zeustech.net/
Licensed to The Apache Software Foundation, http://www.apache.org/

Benchmarking 127.0.0.1 (be patient).....done

Server Software:
Server Hostname:        127.0.0.1
Server Port:            805

Document Path:          /
Document Length:        Variable

Concurrency Level:      10
Time taken for tests:   0.002 seconds
Complete requests:      100
Failed requests:        150
   (Connect: 0, Receive: 100, Length: 0, Exceptions: 50)
Keep-Alive requests:    0
Total transferred:      0 bytes
HTML transferred:       0 bytes
Requests per second:    44984.26 [#/sec] (mean)
Time per request:       0.222 [ms] (mean)
Time per request:       0.022 [ms] (mean, across all concurrent requests)
Transfer rate:          0.00 [Kbytes/sec] received

Connection Times (ms)
              min  mean[+/-sd] median   max
Connect:        0    0   0.0      0       0
Processing:     0    0   0.2      0       0
Waiting:        0    0   0.0      0       0
Total:          0    0   0.2      0       0

Percentage of the requests served within a certain time (ms)
  50%      0
  66%      0
  75%      0
  80%      0
  90%      0
  95%      0
  98%      0
  99%      0
 100%      0 (longest request)
動態頁面測試準備
在本章中,我們將瞭解測試動態頁面所需的準備工作。伺服器端動態網頁是指其構建受處理伺服器端指令碼的應用程式伺服器控制的網頁。apache bench只能負載測試伺服器端動態網頁。
併發級別和請求總數
併發級別應低於請求總數。
$ ab -l -r -n 30 -c 80 -k -H "Accept-Encoding: gzip, deflate" http://127.0.0.1:8000/
輸出
ab: Cannot use concurrency level greater than total number of requests
Usage: ab [options] [http[s]://]hostname[:port]/path
標誌的使用
在本節中,我們將描述ab命令中一些重要標誌的使用。我們將交替使用術語選項和標誌。
詳細 -v
詳細選項可用於分析和除錯是否存在多個失敗請求。負載測試失敗的一個常見跡象是測試非常快地完成,並且為每秒請求值提供了一個良好的數字。但這將是一個錯誤的基準。為了識別成功或失敗,您可以使用-v 2選項,它將每個響應的主體和標題轉儲到終端輸出。以下命令描述了一個用例:
$ ab -n 1 -v 2 http://www.generic-example-URL.com/
輸出
LOG: header received:
HTTP/1.0 200 OK
…
Content-Length: 2548687
當然,如果您正在測試可變響應或在發生任何錯誤時返回非200 HTTP程式碼,則應使用-l選項簡單地忽略長度檢查。當我們在後續章節中啟動web2py應用程式時,我們將很快看到非200 HTTP。
保持活動 -k
當客戶端傳送HTTP請求時,將與伺服器建立連線,伺服器傳送響應,並在傳送請求後關閉連線。此迴圈在每次請求時繼續。但是,使用保持活動設定(也稱為持久連線),客戶端會保持底層TCP連線開啟以促進多個請求和響應;這消除了否則存在的緩慢且代價高昂的連線初始化時間。
可變文件長度 -l
如果網頁長度可變,則應使用選項-l。如果響應的長度不恆定,則Apache Bench不會報告錯誤。這對於動態頁面很有用。
選項 -r的使用
如何強制ab在收到錯誤時不退出?您應該使用選項-r。如果沒有此選項,您的測試可能會在任何請求遇到套接字錯誤時中斷。但是,使用此選項,錯誤將在失敗錯誤標題中報告,但測試將持續到結束。
選項 -H的使用
此選項用於新增任意標題行。引數通常採用有效的標題行形式,包含一個用冒號分隔的欄位-值對(即,“Accept-Encoding: zip/zop;8bit”)。
選項 -C的使用
在下一節中,我們將詳細瞭解如何在結合使用選項以使用cookie值(即-C選項)的情況下使用上述選項。-C選項通常採用name = value對的形式。此欄位可以重複。
將會話Cookie與Apache Bench一起使用
要了解如何在Apache Bench中使用cookie,我們需要一個嘗試設定cookie的網頁。一個很好的例子是web2py應用程式,它是一個Python Web框架。
安裝web2py
我們將快速安裝另一個Python應用程式web2py。您可以在Web2py框架概述上閱讀有關如何使用它的更多資訊。
Python通常在Ubuntu和Debian伺服器上預設安裝。因此,已經滿足了一個成功執行web2py的要求。
但是,我們需要安裝unzip包以從我們將要下載的zip檔案中提取web2py的原始檔:
$ sudo apt-get update
$ sudo apt-get install unzip
讓我們從專案的網站獲取web2py框架。我們將將其下載到我們的主資料夾:
$cd ~
$ wget http://www.web2py.com/examples/static/web2py_src.zip
現在,我們可以解壓縮剛剛下載的檔案並進入其中:
$ unzip web2py_src.zip
$ cd web2py
要執行web2py,您無需安裝它。進入web2py目錄後,您可以透過鍵入以下命令來執行它:
$python web2py.py
如果一切順利,您將看到以下輸出,其中系統會要求您為管理UI選擇密碼:
web2py Web Framework
Created by Massimo Di Pierro, Copyright 2007-2017
Version 2.14.6-stable+timestamp.2016.05.10.00.21.47
Database drivers available: sqlite3, imaplib, pymysql, pg8000
WARNING:web2py:GUI not available because Tk library is not installed
choose a password:

please visit:
        http://127.0.0.1:8000/
use "kill -SIGTERM 23904" to shutdown the web2py server
但是,您需要注意的是,啟動的Web介面只能在本地機器上訪問。
從輸出中,您可以瞭解到,要停止 Web 伺服器,您需要在即時終端中輸入“CTRL-C”。另一方面,要停止與同一 VPS 相關的另一個終端上的 web2py 伺服器,您可以插入命令 kill -SIGTERM <PID>,其中 <PID> 是 web2py 伺服器的程序 ID,在本例中為 23904。
來自 web2py 的會話 Cookie
如果一個頁面只能由已登入的使用者訪問,而不能直接從登入頁面訪問,那麼在這種情況下,您可以使用-C標誌。此標誌為 ab 命令定義了一個 cookie。但是您必須從有效的會話中獲取會話識別符號 cookie 的值。如何獲取?各種線上教程將引導您使用 Chrome(或 Mozilla)瀏覽器開發者工具。但在我們的測試用例中,由於應用程式僅在命令列上可用,因此我們將使用 lynx 瀏覽器獲取該值。
讓我們首先獲取會話的 cookie 值。開啟另一個終端並輸入以下命令:
$ lynx http://127.0.0.1:8000/
響應上述命令,lynx 將詢問您是否允許接受來自 web2py 伺服器的 cookie,如下面的影像所示。
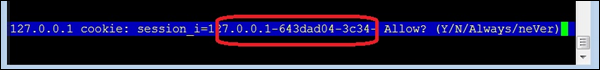
在輸入y接受 cookie 之前記下 cookie 值。現在終端將類似於以下影像 - 終端上的網站!
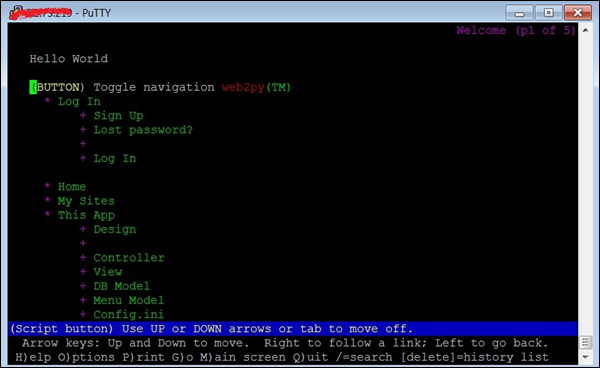
獲得 cookie 值後,我們現在將執行 ab 測試。為此,我們將不得不開啟第三個終端(見下圖):
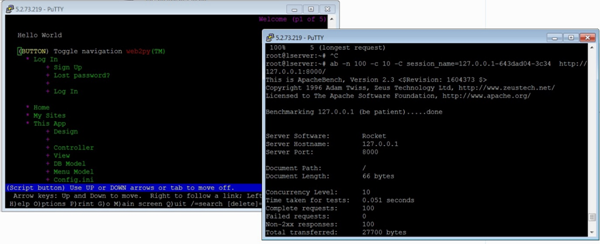
現在,讓我們在第三個終端中使用 -C 標誌:
$ ab -n 100 -c 10 -C session_name = 127.0.0.1-643dad04-3c34 http://127.0.0.1:8000/
輸出
This is ApacheBench, Version 2.3 <$Revision: 1604373 $>
Copyright 1996 Adam Twiss, Zeus Technology Ltd, http://www.zeustech.net/
Licensed to The Apache Software Foundation, http://www.apache.org/

Benchmarking 127.0.0.1 (be patient).....done


Server Software:        Rocket
Server Hostname:        127.0.0.1
Server Port:            8000

Document Path:          /
Document Length:        66 bytes

Concurrency Level:      10
Time taken for tests:   0.051 seconds
Complete requests:      100
Failed requests:        0
Non-2xx responses:      100
Total transferred:      27700 bytes
HTML transferred:       6600 bytes
Requests per second:    1968.12 [#/sec] (mean)
Time per request:       5.081 [ms] (mean)
Time per request:       0.508 [ms] (mean, across all concurrent requests)
Transfer rate:          532.39 [Kbytes/sec] received

Connection Times (ms)
              min  mean[+/-sd] median   max
Connect:        1    2   0.9      2       4
Processing:     0    3   0.9      3       5
Waiting:        0    2   1.1      2       4
Total:          4    5   0.7      5       7

Percentage of the requests served within a certain time (ms)
  50%      5
  66%      5
  75%      5
  80%      6
  90%      6
  95%      6
  98%      7
  99%      7
 100%      7 (longest request)
從上面的輸出中,我們注意到幾點。首先,web2py 使用 Rocket Web 伺服器。我們還注意到,除了之前在輸出中討論的標題外,我們還得到了“非 2xx 響應”。一般來說,Http 協議使用響應程式碼來響應請求,200 區間內的任何內容都表示“確定”,其餘內容則對應於某些問題。例如,400 區間是與資源相關的錯誤,例如 404 檔案未找到。500 區間對應於伺服器錯誤。在我們的這個例子中,除了使用 -C 選項時之外,沒有任何錯誤。它可以使用 -l 選項來抑制,如前所述。
檢查管理頁面
在本節中,我們將瞭解如何檢查管理頁面。為了比較的目的,讓我們測試 web2py 應用程式的另一個 URL:
$ ab -n 100 -c 10 session_name = 127.0.0.1-643dad04-3c34 http://127.0.0.1:8000/admin
輸出
This is ApacheBench, Version 2.3 <$Revision: 1604373 $>
Copyright 1996 Adam Twiss, Zeus Technology Ltd, http://www.zeustech.net/
Licensed to The Apache Software Foundation, http://www.apache.org/

Benchmarking 127.0.0.1 (be patient).....done


Server Software:        Rocket
Server Hostname:        127.0.0.1
Server Port:            8000

Document Path:          /admin
Document Length:        8840 bytes

Concurrency Level:      10
Time taken for tests:   2.077 seconds
Complete requests:      100
Failed requests:        0
Total transferred:      926700 bytes
HTML transferred:       884000 bytes
Requests per second:    48.14 [#/sec] (mean)
Time per request:       207.749 [ms] (mean)
Time per request:       20.775 [ms] (mean, across all concurrent requests)
Transfer rate:          435.61 [Kbytes/sec] received

Connection Times (ms)
          min  mean[+/-sd] median   max
Connect:        0    1   3.2      0      12
Processing:    62  204  52.2    199     400
Waiting:       61  203  52.0    199     400
Total:         62  205  54.3    199     411

Percentage of the requests served within a certain time (ms)
  50%    199
  66%    211
  75%    220
  80%    226
  90%    264
  95%    349
  98%    381
  99%    411
 100%    411 (longest request)
您應該特別注意http://127.0.0.1:8000/和http://127.0.0.1:8000/admin的“連線時間”和“請求服務百分比”部分中的相關統計資料。差別很大。
使用 Timelimit 選項
通常,Timelimit 選項是一個棘手的選項。讓我們從ab 手冊中瞭解這一點,它非常具有解釋性:
-t timelimit
Maximum number of seconds to spend for benchmarking. This implies a -n 50000 internally.
Use this to benchmark the server within a fixed total amount of time.
Per default there is no timelimit.
讓我們使用此選項執行一個測試。在檢視輸出後,我們將記下我們的觀察結果:
$ ab -n 100 -c 10 -t 60 http://127.0.0.1:8000/
輸出
This is ApacheBench, Version 2.3 <$Revision: 1604373 $>
Copyright 1996 Adam Twiss, Zeus Technology Ltd, http://www.zeustech.net/
Licensed to The Apache Software Foundation, http://www.apache.org/

Benchmarking 127.0.0.1 (be patient)
Completed 5000 requests
Completed 10000 requests
Completed 15000 requests
Completed 20000 requests
Completed 25000 requests
Completed 30000 requests
Completed 35000 requests
Completed 40000 requests
Completed 45000 requests
Completed 50000 requests
Finished 50000 requests


Server Software:        Rocket
Server Hostname:        127.0.0.1
Server Port:            8000

Document Path:          /
Document Length:        66 bytes

Concurrency Level:      10
Time taken for tests:   22.547 seconds
Complete requests:      50000
Failed requests:        0
Non-2xx responses:      50000
Total transferred:      13850000 bytes
HTML transferred:       3300000 bytes
Requests per second:    2217.61 [#/sec] (mean)
Time per request:       4.509 [ms] (mean)
Time per request:       0.451 [ms] (mean, across all concurrent requests)
Transfer rate:          599.88 [Kbytes/sec] received

Connection Times (ms)
              min  mean[+/-sd] median   max
Connect:        0    2   0.8      2       8
Processing:     0    2   3.2      2     218
Waiting:        0    2   3.2      2     218
Total:          2    4   3.1      4     220

Percentage of the requests served within a certain time (ms)
  50%      4
  66%      4
  75%      4
  80%      5
  90%      5
  95%      5
  98%      7
  99%      8
 100%    220 (longest request)
請注意,輸出顯示此選項會覆蓋-n選項指定的請求數量,並持續執行多達 50K 個請求。但是,由於請求處理得非常快,ab 一旦達到 50k 標記就會立即終止 - 在本例中,在 22 秒內(請參閱標題“測試花費的時間”)。
您可以測試相同的命令,將http://127.0.0.1:8000/替換為http://127.0.0.1:8000/admin(假設它是我們的 web2py 應用程式)或第三方網站,例如 https://www.apache.org/,注意統計資料的差異。
執行負載測試前的檢查清單
有一些檢查將幫助您成功執行測試並準確地衡量效能。在執行負載測試之前,請考慮以下條件:
確保沒有載入額外的 Python 模組。
為了避免 TCP/IP 埠耗盡,您通常應該在轉到另一個 ab 測試之前等待 2-3 分鐘。
確保併發連線數低於 Apache 工作執行緒數。
如果 Apache 或 Python 崩潰,您應該在執行另一個測試之前重新啟動伺服器。
動態頁面的順序測試用例
在本章中,我們將描述-n和-c與重要標誌的各種組合,以逐漸增加 Web 伺服器上的負載。
您應該主要關注以下指標在您增加負載時的變化情況:
- 每秒請求數
- 連線時間(毫秒)
- 在特定時間(毫秒)內完成的請求百分比
您還應該注意伺服器開始卡住並開始出現失敗請求時的閾值。
1 個併發使用者執行 100 次頁面點選
讓我們由單個使用者執行 100 次順序頁面載入:
$ ab -l -r -n 100 -c 1 -k -H "Accept-Encoding: gzip, deflate" http://127.0.0.1:8000/
輸出
This is ApacheBench, Version 2.3 <$Revision: 1604373 $>
Copyright 1996 Adam Twiss, Zeus Technology Ltd, http://www.zeustech.net/
Licensed to The Apache Software Foundation, http://www.apache.org/

Benchmarking 127.0.0.1 (be patient).....done


Server Software:        Rocket
Server Hostname:        127.0.0.1
Server Port:            8000

Document Path:          /
Document Length:        Variable

Concurrency Level:      1
Time taken for tests:   0.045 seconds
Complete requests:      100
Failed requests:        0
Non-2xx responses:      100
Keep-Alive requests:    0
Total transferred:      27700 bytes
HTML transferred:       6600 bytes
Requests per second:    2206.24 [#/sec] (mean)
Time per request:       0.453 [ms] (mean)
Time per request:       0.453 [ms] (mean, across all concurrent requests)
Transfer rate:          596.80 [Kbytes/sec] received

Connection Times (ms)
              min  mean[+/-sd] median   max
Connect:        0    0   0.0      0       0
Processing:     0    0   0.0      0       0
Waiting:        0    0   0.0      0       0
Total:          0    0   0.0      0       1

Percentage of the requests served within a certain time (ms)
  50%      0
  66%      0
  75%      0
  80%      0
  90%      1
  95%      1
  98%      1
  99%      1
 100%      1 (longest request)
5 個併發使用者,每個使用者執行 10 次頁面點選
此案例對應於每月獲得約 50,000+ 次點選的網站的峰值負載。
$ ab -l -r -n 10 -c 5 -k -H "Accept-Encoding: gzip, deflate" http://127.0.0.1:8000/
在以下後續輸出中,為了清晰起見,我們將省略通用標題。
輸出
...
Requests per second:    2009.24 [#/sec] (mean)
Time per request:       2.488 [ms] (mean)
Time per request:       0.498 [ms] (mean, across all concurrent requests)
Transfer rate:          543.52 [Kbytes/sec] received

Connection Times (ms)
              min  mean[+/-sd] median   max
Connect:        0    1   0.5      1       2
Processing:     0    1   0.5      1       2
Waiting:        0    1   0.5      1       1
Total:          2    2   0.4      3       3
ERROR: The median and mean for the total time are more than twice the standard
       deviation apart. These results are NOT reliable.

Percentage of the requests served within a certain time (ms)
  50%      3
  66%      3
  75%      3
  80%      3
  90%      3
  95%      3
  98%      3
  99%      3
 100%      3 (longest request)
10 個併發使用者,每個使用者執行 10 次頁面點選
此測試對應於 10 個不同的併發使用者執行 100 次頁面載入,每個使用者執行 10 次順序頁面載入。
$ ab -r -n 10 -c 10 -k -H "Accept-Encoding: gzip, deflate" http://127.0.0.1:8000/
輸出
...
Requests per second:    2225.68 [#/sec] (mean)
Time per request:       4.493 [ms] (mean)
Time per request:       0.449 [ms] (mean, across all concurrent requests)
Transfer rate:          602.07 [Kbytes/sec] received

Connection Times (ms)
              min  mean[+/-sd] median   max
Connect:        1    2   0.7      2       3
Processing:     0    2   1.0      2       3
Waiting:        0    1   1.0      2       3
Total:          4    4   0.3      4       4
WARNING: The median and mean for the waiting time are not within a normal deviation
        These results are probably not that reliable.

Percentage of the requests served within a certain time (ms)
  50%      4
  66%      4
  75%      4
  80%      4
  90%      4
  95%      4
  98%      4
  99%      4
 100%      4 (longest request)
20 個併發使用者,每個使用者執行 20 次頁面點選
此測試對應於 20 個不同的併發使用者執行 400 次頁面載入,每個使用者執行 20 次順序頁面載入。
$ ab -r -n 20 -c 20 -k -H “Accept-Encoding: gzip, deflate” http://127.0.0.1:8000/
輸出
...
Requests per second:    1619.96 [#/sec] (mean)
Time per request:       12.346 [ms] (mean)
Time per request:       0.617 [ms] (mean, across all concurrent requests)
Transfer rate:          438.21 [Kbytes/sec] received

Connection Times (ms)
              min  mean[+/-sd] median   max
Connect:        2    6   2.3      6      10
Processing:     1    5   2.9      5      10
Waiting:        0    5   2.9      5       9
Total:         10   11   0.6     11      12

Percentage of the requests served within a certain time (ms)
  50%     11
  66%     11
  75%     12
  80%     12
  90%     12
  95%     12
  98%     12
  99%     12
 100%     12 (longest request)
30 個併發使用者,每個使用者執行 30 次頁面點選
此測試對應於 30 個不同的併發使用者執行 900 次頁面載入,每個使用者執行 30 次順序頁面載入。
$ ab -r -n 30 -c 30 -k -H "Accept-Encoding: gzip, deflate" http://127.0.0.1:8000/
輸出
...
Requests per second:    2283.45 [#/sec] (mean)
Time per request:       13.138 [ms] (mean)
Time per request:       0.438 [ms] (mean, across all concurrent requests)
Transfer rate:          617.69 [Kbytes/sec] received

Connection Times (ms)
              min  mean[+/-sd] median   max
Connect:        2    6   2.7      6      11
Processing:     1    6   3.1      6      11
Waiting:        0    5   3.2      5      10
Total:         11   12   0.5     12      13

Percentage of the requests served within a certain time (ms)
  50%     12
  66%     12
  75%     12
  80%     12
  90%     13
  95%     13
  98%     13
  99%     13
 100%     13 (longest request)
我們現在已經瞭解瞭如何逐漸增加網站的負載並測試其效能。
Apache Bench - 輸出比較
在本章中,我們將比較帶有和不帶標誌的輸出。讓我們看看如何使用適當的標誌可以提高 Web 應用程式的效能。在此之前,我們需要了解如果您的應用程式很簡單,那麼您可能不會注意到差異。就像我們的簡單應用程式一樣,使用標誌和不使用標誌。然後,我們將使用 https://www.apache.org/ URL 執行相同的測試,並檢視差異。
測試我們的應用程式(不帶標誌)
在本節中,我們將瞭解如何測試我們的應用程式(不帶標誌)。
$ ab -n 100 -c 10 http://127.0.0.1:8000/
輸出
This is ApacheBench, Version 2.3 <$Revision: 1604373 $>
Copyright 1996 Adam Twiss, Zeus Technology Ltd, http://www.zeustech.net/
Licensed to The Apache Software Foundation, http://www.apache.org/

Benchmarking 127.0.0.1 (be patient).....done


Server Software:        Rocket
Server Hostname:        127.0.0.1
Server Port:            8000

Document Path:          /
Document Length:        Variable

Concurrency Level:      10
Time taken for tests:   0.244 seconds
Complete requests:      100
Failed requests:        0
Non-2xx responses:      100
Keep-Alive requests:    0
Total transferred:      27700 bytes
HTML transferred:       6600 bytes
Requests per second:    2208.77 [#/sec] (mean)
Time per request:       4.527 [ms] (mean)
Time per request:       0.453 [ms] (mean, across all concurrent requests)
Transfer rate:          597.49 [Kbytes/sec] received

Connection Times (ms)
              min  mean[+/-sd] median   max
Connect:        1    2   0.7      2       3
Processing:     0    2   0.7      2       4
Waiting:        0    2   1.0      2       3
Total:          4    4   0.3      4       5

Percentage of the requests served within a certain time (ms)
  50%      4
  66%      4
  75%      5
  80%      5
  90%      5
  95%      5
  98%      5
  99%      5
 100%      5 (longest request)
測試我們的應用程式(帶標誌)
在本節中,我們將瞭解如何測試我們的應用程式(帶標誌)。
$ ab -l -r -n 100 -c 10 -k -H "Accept-Encoding: gzip, deflate" http://127.0.0.1:8000/
輸出
...
Requests per second:    2277.07 [#/sec] (mean)
Time per request:       4.392 [ms] (mean)
Time per request:       0.439 [ms] (mean, across all concurrent requests)
Transfer rate:          615.97 [Kbytes/sec] received

Connection Times (ms)
              min  mean[+/-sd] median   max
Connect:        1    2   0.7      2       3
Processing:     0    2   0.7      2       4
Waiting:        0    2   1.0      2       3
Total:          4    4   0.2      4       5

Percentage of the requests served within a certain time (ms)
  50%      4
  66%      4
  75%      4
  80%      4
  90%      5
  95%      5
  98%      5
  99%      5
 100%      5 (longest request)
我們可以簡單地注意到輸出統計資料之間沒有太大差異。
測試 Apache 組織網站(不帶標誌)
現在讓我們看看如何測試 Apache 組織網站(不帶標誌)。
$ ab -n 100 -c 10 http://www.apache.org/
輸出
This is ApacheBench, Version 2.3 <$Revision: 1604373 $>
Copyright 1996 Adam Twiss, Zeus Technology Ltd, http://www.zeustech.net/
Licensed to The Apache Software Foundation, http://www.apache.org/

Benchmarking www.apache.org (be patient).....done

Server Software:        Apache/2.4.7
Server Hostname:        www.apache.org
Server Port:            80

Document Path:          /
Document Length:        58433 bytes

Concurrency Level:      10
Time taken for tests:   1.498 seconds
Complete requests:      100
Failed requests:        0
Total transferred:      5877500 bytes
HTML transferred:       5843300 bytes
Requests per second:    66.74 [#/sec] (mean)
Time per request:       149.840 [ms] (mean)
Time per request:       14.984 [ms] (mean, across all concurrent requests)
Transfer rate:          3830.58 [Kbytes/sec] received

Connection Times (ms)
              min  mean[+/-sd] median   max
Connect:       12  110 295.2     12    1012
Processing:    37   38   0.5     38      39
Waiting:       12   13   0.3     13      15
Total:         49  147 295.4     50    1051

Percentage of the requests served within a certain time (ms)
  50%     50
  66%     50
  75%     50
  80%     50
  90%    816
  95%   1050
  98%   1051
  99%   1051
 100%   1051 (longest request)
測試 Apache 組織網站(帶標誌)
現在讓我們使用標誌測試 Apache 組織網站。
$ ab -l -r -n 100 -c 10 -k -H "Accept-Encoding: gzip, deflate" http://www.apache.org/
輸出
...
Document Length:        Variable

Concurrency Level:      10
Time taken for tests:   0.357 seconds
Complete requests:      100
Failed requests:        0
Keep-Alive requests:    100
Total transferred:      1358510 bytes
HTML transferred:       1317700 bytes
Requests per second:    280.28 [#/sec] (mean)
Time per request:       35.678 [ms] (mean)
Time per request:       3.568 [ms] (mean, across all concurrent requests)
Transfer rate:          3718.41 [Kbytes/sec] received

Connection Times (ms)
              min  mean[+/-sd] median   max
Connect:        0    1   3.7      0      12
Processing:    14   17  21.3     15     227
Waiting:       14   17  21.3     14     227
Total:         14   18  21.5     15     227

Percentage of the requests served within a certain time (ms)
  50%     15
  66%     15
  75%     15
  80%     15
  90%     27
  95%     28
  98%     29
  99%    227
 100%    227 (longest request)
您可以簡單地注意到,使用標誌後每秒請求數增加了。在本例中,這尤其歸因於使用-H "Accept-Encoding: gzip, deflate,因為此標誌告訴 Apache 伺服器以gzipped格式提供請求。
考慮 Apache Bench 結果
在涉及 Apache Bench 結果時,需要考慮一些重要事項。這將幫助我們設計整體策略,以消除應用程式中的瓶頸並提高其效能。
我們需要每秒請求數。這讓我們瞭解 Web 伺服器設定執行狀況如何;數字越大,效能越好。然後是連線時間(毫秒)和請求服務百分比。您可能需要調整 Web 伺服器的設定,以將這些指標更改為您所需的效能。
檢查 Apache 或使用的 Web 伺服器錯誤日誌或(通用)日誌中是否存在錯誤。隨著負載的增加,事情將開始變得擁堵:記憶體問題將開始出現。如果未考慮到併發性,許多 Python 指令碼將開始崩潰。
您需要找出 Web 伺服器崩潰和/或超時時的關鍵併發值是多少?通常,這應該發生在相當高的併發級別。如果此值較低,則說明某些地方出現了問題,您需要調整這些設定(降低/提高)。
結論
在本教程中,我們學習瞭如何使用 Apache Bench 來負載測試任何網站或 Web 應用程式。Apache Bench 可以成為確定如何改進 Web 應用程式伺服器設定(以減少瓶頸並提高效能)的非常有價值的工具。現在您已經熟悉了 Apache Bench 的基本用法,您可以開始建立新的測試計劃,以在各種場景中衡量應用程式的效能。