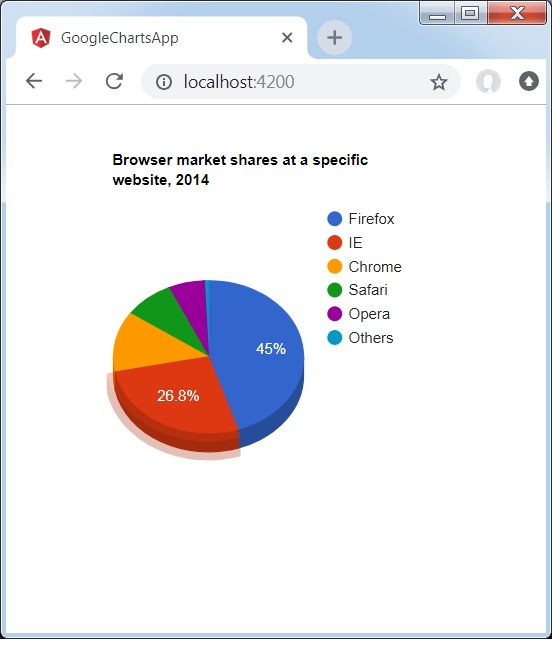
Angular Google 圖表 - 三維餅狀圖
以下是一個三維圖表的示例。
我們已經看到了用於在 Google 圖表配置語法 章節中繪製圖表的配置。現在,讓我們看一個甜甜圈圖的示例。
配置
我們使用 **is3D** 配置將餅狀圖顯示為三維餅狀圖。
options = {
   is3D:true
};
示例
app.component.ts
import { Component } from '@angular/core';
@Component({
   selector: 'app-root',
   templateUrl: './app.component.html',
   styleUrls: ['./app.component.css']
})
export class AppComponent {
   title = 'Browser market shares at a specific website, 2014';
   type = 'PieChart';
   data = [
      ['Firefox', 45.0],
      ['IE', 26.8],
      ['Chrome', 12.8],
      ['Safari', 8.5],
      ['Opera', 6.2],
      ['Others', 0.7]
   ];
   columnNames = ['Browser', 'Percentage'];
   options = {
      is3D:true
   };
   width = 550;
   height = 400;
}
結果
驗證結果。
angular_googlecharts_pie_charts.htm
廣告