
 資料結構
資料結構 網路
網路 RDBMS
RDBMS 作業系統
作業系統 Java
Java iOS
iOS HTML
HTML CSS
CSS Android
 Python
 C 程式設計
 C++
C++ C#
C# MongoDB
 MySQL
MySQL Javascript
 PHP
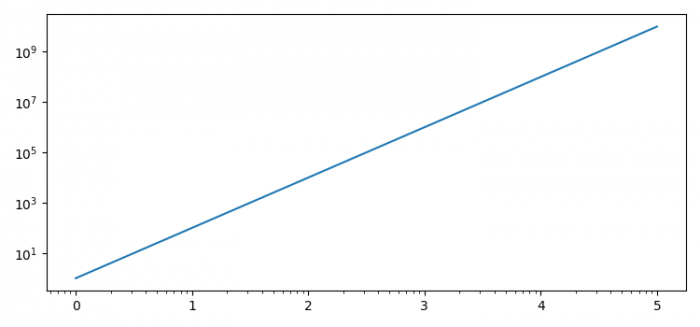
PHP用計算出的值替換 matplotlib 刻度標記的正確方法是什麼?
我們可以使用 ax.loglog(x, y) 和 set_major_formatter() 方法用計算出的值替換刻度標籤。
步驟
設定圖形大小並調整子圖之間和周圍的填充。
建立一個圖形和一組子圖。
對 X 和 Y 軸進行對數縮放繪製一個圖形。
設定主要刻度線的格式化程式。
若要顯示圖形,請使用 show() 方法。
示例
import numpy as np
from matplotlib import pyplot as plt, ticker

plt.rcParams["figure.figsize"] = [7.50, 3.50]
plt.rcParams["figure.autolayout"] = True

fig, ax = plt.subplots()

ax.loglog(np.logspace(0, 5), np.logspace(0, 5)**2)

ax.xaxis.set_major_formatter(ticker.LogFormatterExponent())

plt.show()
輸出

更新於: 2021 年 9 月 23 日
290 次瀏覽

廣告