
 資料結構
資料結構 網路
網路 關係資料庫管理系統
 作業系統
作業系統 Java
Java iOS
iOS HTML
HTML CSS
CSS Android
 Python
 C 語言程式設計
 C++
C++ C#
C# MongoDB
 MySQL
MySQL Javascript
 PHP
PHP使用 Python-3 跟蹤鳥類遷徙
在一些研究工作中,研究員使用 GPS 模組跟蹤動物行為。他們能追蹤它們在一年中的不同時間如何前往不同的地點等。
在這個示例中,我們使用這種資料集來了解鳥類如何在不同的地方移動。這個資料集儲存了從 GPS 模組獲得的位置資訊。 完整的資料集採用 CSV 格式。在這個檔案中,有不同的欄位。第一個是鳥類的 ID,然後是日期時間、緯度、經度和速度。
對於此任務,我們需要一些可以在 Python 程式碼中使用的模組。
我們使用 matplotlib、pandas 和 cartopy 模組。若要在 Anaconda 中安裝它們,請遵循以下命令。它在需要時將安裝一些其他重要模組。
conda install -c conda-forge matplotlib
conda install -c anaconda pandas
conda install -c scitools/label/archive cartopy
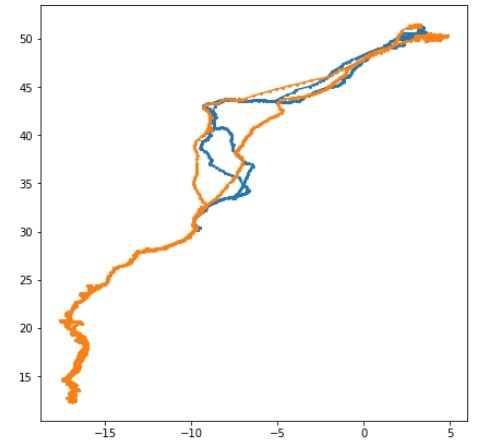
首先,我們將使用緯度和經度值繪製位置。因為資料集中有兩個鳥,所以使用兩種不同的顏色,我們可以視覺化追蹤位置
示例程式碼
import pandas as pd
from matplotlib import pyplot as plt
df = pd.read_csv('bird_tracking.csv')
cr = df.groupby('bird_id').groups
cr_groups = df.groupby('bird_id')
group_list = []
for group in cr:
   group_list.append(group)
plt.figure(figsize=(7, 7))
#Create graph from dataset using the first group of cranes
for group in group_list:
   x,y = cr_groups.get_group(group).longitude, cr_groups.get_group(group).latitude
   plt.plot(x,y, marker='o', markersize=2)
plt.show()
輸出
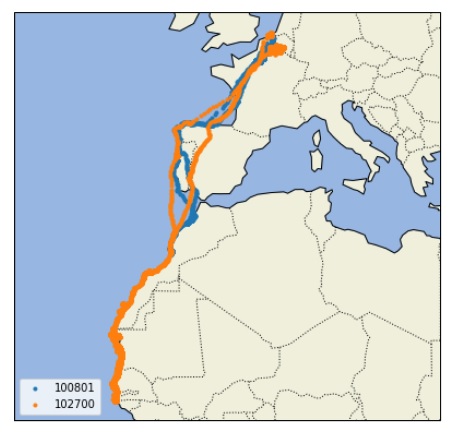
現在,我們可以在真實的地理地圖上繪製此追蹤結果,以視覺化那些鳥類使用的的確切路徑。
示例程式碼
import pandas as pd
import cartopy.crs as ccrs
import cartopy.feature as cfeature
import matplotlib.pyplot as plt
df = pd.read_csv("bird_tracking.csv")
bird_id = pd.unique(birddata.bird_id)
# Setup the projection to display the details into map
projection = ccrs.Mercator()
plt.figure(figsize=(7,7))
axes = plt.axes(projection=projection)
axes.set_extent((-30.0, 25.0, 50.0, 10.0))
axes.add_feature(cfeature.LAND)
axes.add_feature(cfeature.OCEAN)
axes.add_feature(cfeature.COASTLINE)
axes.add_feature(cfeature.BORDERS, linestyle=':')
for id in bird_id:
   index = df['bird_id'] == id
   x = df.longitude[index]
   y = df.latitude[index]
   axes.plot(x,y,'.', transform=ccrs.Geodetic(), label=id)
plt.legend(loc="lower left")
plt.show()
輸出

更新日期:2019 年 7 月 30 日
333 次瀏覽

廣告