
 資料結構
資料結構 網路
網路 RDBMS
RDBMS 作業系統
作業系統 Java
Java iOS
iOS HTML
HTML CSS
CSS Android
 Python
 C 程式設計
 C++
C++ C#
C# MongoDB
 MySQL
MySQL Javascript
 PHP
PHP使用 Matplotlib 儲存滑鼠點選事件座標
要將滑鼠事件座標儲存到 Matplotlib 中,我們可以使用 "button_press_event" 事件。−
步驟
- 設定圖形尺寸,並調整子圖之間的內邊距和四周內邊距。
- 建立一個圖形和一組子圖。
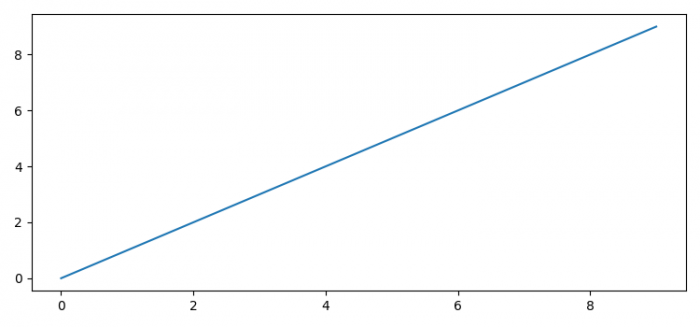
- 在 10 的範圍內繪製一條線
- 將函式 *onclick* 繫結到事件 *button_press_event*。
- 列印事件的 x 和 y 資料。
- 要顯示圖形,請使用 show() 方法。
示例
from matplotlib import pyplot as plt

plt.rcParams['backend'] = 'TkAgg'
plt.rcParams["figure.figsize"] = [7.50, 3.50]
plt.rcParams["figure.autolayout"] = True

# Function to print mouse click event coordinates
def onclick(event):
   print([event.xdata, event.ydata])

# Create a figure and a set of subplots
fig, ax = plt.subplots()

# Plot a line in the range of 10
ax.plot(range(10))

# Bind the button_press_event with the onclick() method
fig.canvas.mpl_connect('button_press_event', onclick)

# Display the plot
plt.show()
輸出
執行後,它將產生以下輸出
現在,點選圖中的任意位置,它將顯示控制檯中該點的座標
[6.277811659536052 6.218189947945731]
[4.9416949672083685 3.7079096112932475]
[8.221254287227506 3.4145010811941963]

更新於: 07-Oct-2021
2K+ 瀏覽量

廣告