
 資料結構
資料結構 網路
網路 RDBMS
RDBMS 作業系統
作業系統 Java
Java iOS
iOS HTML
HTML CSS
CSS 安卓
安卓 Python
 C 程式設計
 C++
C++ C#
C# MongoDB
 MySQL
MySQL Javascript
 PHP
PHPMatplotlib - 如何在滑鼠點選時顯示一個點的座標?
在 matplotlib 中建立自定義滑鼠游標,我們可以採取以下步驟
步驟
設定圖形大小並調整子圖之間及周圍的填充。
建立一個新圖形或啟用一個現有圖形。
將函式*mouse_event*繫結到事件*button_press_event*。
使用 numpy 建立x和y資料點。
使用plot()方法繪製x和y資料點。
要顯示圖形,請使用Show()方法。
示例
import numpy as np
from matplotlib import pyplot as plt

plt.rcParams["figure.figsize"] = [7.00, 3.50]
plt.rcParams["figure.autolayout"] = True

def mouse_event(event):
    print('x: {} and y: {}'.format(event.xdata, event.ydata))

fig = plt.figure()
cid = fig.canvas.mpl_connect('button_press_event', mouse_event)

x = np.linspace(-10, 10, 100)
y = np.sin(x)

plt.plot(x, y)

plt.show()
輸出
它將產生以下輸出 -
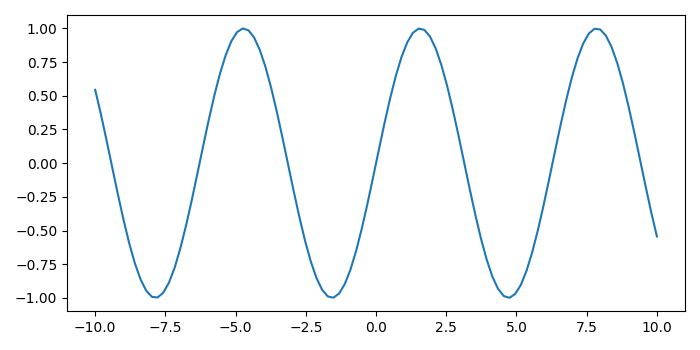
現在,單擊繪圖中的不同點,它將在控制檯上顯示它們的座標。
x: -3.099305446290094 and y: -0.013811108549791173
x: -0.2865652183685867 and y: -0.2067543563498595
x: -3.0280968329249927 and y: -0.1844916739113902
x: -5.7696284474814 and y: 0.4240216460734405
x: -3.9182044999887626 and y: 0.6837529411889172

更新日期: 11-10-2021
8K+ 瀏覽量

廣告