
 資料結構
資料結構 網路
網路 RDBMS
RDBMS 作業系統
作業系統 Java
Java iOS
iOS HTML
HTML CSS
CSS Android
 Python
 C 程式設計
 C++
C++ C#
C# MongoDB
 MySQL
MySQL Javascript
 PHP
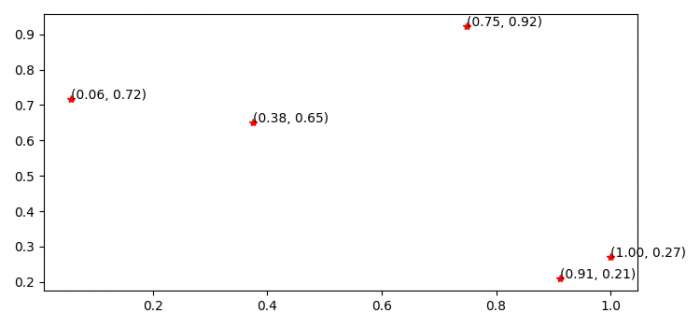
PHP在 Python Matplotlib 中顯示繪圖中的座標點
要在 Python 中顯示繪圖中的點座標,我們可以採取以下步驟 -
步驟
設定圖形大小並調整子圖之間和周圍的間距。
初始化變數 N,並使用 numpy 建立 x 和 y 資料點。
壓縮 x 和 y 資料點;迭代它們並放置座標。
要顯示圖形,請使用 show() 方法。
示例
import matplotlib.pyplot as plt
import numpy as np

plt.rcParams["figure.figsize"] = [7.50, 3.50]
plt.rcParams["figure.autolayout"] = True

N = 5

x = np.random.rand(N)
y = np.random.rand(N)

plt.plot(x, y, 'r*')

for xy in zip(x, y):
   plt.annotate('(%.2f, %.2f)' % xy, xy=xy)

plt.show()
輸出
它將產生以下輸出 -

更新日期: 02 月 02 日 2022
14K+ 瀏覽量

廣告