
 資料結構
資料結構 網路
網路 RDBMS
RDBMS 作業系統
作業系統 Java
Java iOS
iOS HTML
HTML CSS
CSS Android
 Python
 C 程式設計
 C++
C++ C#
C# MongoDB
 MySQL
MySQL Javascript
 PHP
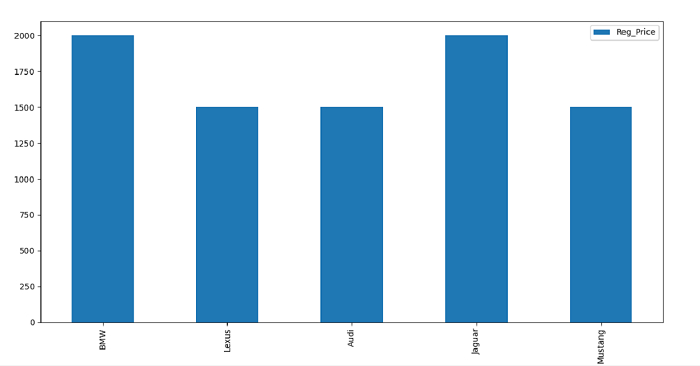
PHPPython - 如何將一個 Pandas 資料幀繪製成條形圖
假設以下內容是 CSV 檔案的內容 -
       Car   Reg_Price
0      BMW        2000
1    Lexus        1500
2     Audi        1500
3   Jaguar        2000
4  Mustang        1500
匯入所需的庫 -
import pandas as pd
import matplotlib.pyplot as mp
我們的 CSV 檔案在桌面上。將 CSV 檔案中的資料載入到 Pandas 資料幀中 -
d = pd.read_csv("C:\Users\amit_\Desktop\SalesData.csv")

dataFrame = pd.DataFrame(d.head(), columns=["Car","Reg_Price"])
繪製資料幀 -
dataFrame.plot(x="Car", y="Reg_Price", kind="bar", figsize=(10, 9))
示例
以下是程式碼 -
import pandas as pd
import matplotlib.pyplot as mp

# read csv
d = pd.read_csv("C:\Users\amit_\Desktop\SalesData.csv")
print("\nReading the CSV file...\n",d)

# dataframe
dataFrame = pd.DataFrame(d.head(), columns=["Car","Reg_Price"])

# plotting the dataframe
dataFrame.plot(x="Car", y="Reg_Price", kind="bar", figsize=(10, 9))

# displaying bar graph
mp.show()
輸出
將顯示以下輸出 -

更新於: 2021-9-29
3K+ 瀏覽量

廣告