
 資料結構
資料結構 網路
網路 RDBMS
RDBMS 作業系統
作業系統 Java
Java iOS
iOS HTML
HTML CSS
CSS Android
 Python
 C 程式設計
 C++
C++ C#
C# MongoDB
 MySQL
MySQL Javascript
 PHP
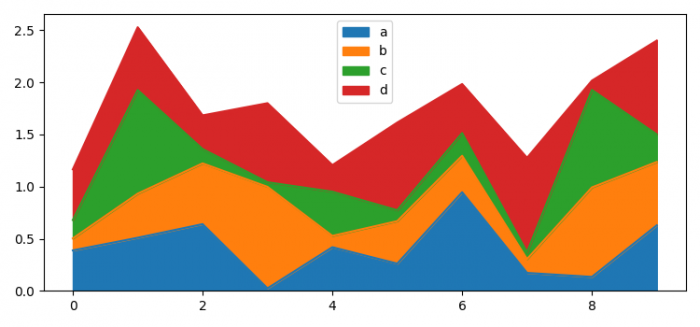
PHP如何在 Matplotlib Python 中繪製 Pandas 資料框中的區域圖?
要在 Matplotlib Python 中繪製 Pandas 資料框中的面積圖,我們可以按照以下步驟操作:
- 設定圖形大小並調整子圖之間和周圍的間距。
- 建立一個 Pandas 資料框,即大小可變、可能異構的二維表格資料。
- 返回圖形繪製之間的面積。
- 要顯示圖形,請使用 show() 方法。
例項
import pandas as pd
import numpy as np

from matplotlib import pyplot as plt

plt.rcParams["figure.figsize"] = [7.50, 3.50]
plt.rcParams["figure.autolayout"] = True

df = pd.DataFrame(np.random.rand(10, 4),
columns=["a", "b", "c", "d"])

df.plot.area()

plt.show()
輸出

更新於:18-6-2021
2K+ 次瀏覽

廣告