
 資料結構
資料結構 網路
網路 RDBMS
RDBMS 作業系統
作業系統 Java
Java iOS
iOS HTML
HTML CSS
CSS Android
 Python
 C 程式設計
 C++
C++ C#
C# MongoDB
 MySQL
MySQL Javascript
 PHP
PHP在 Matplotlib 中疊加 contourf 圖和 surface_plot
要在 matplotlib 中疊加 contourf 圖和 surface_plot,我們可以執行以下步驟:
使用 numpy 初始化變數,delta、xrange、yrange、x 和 y。
使用 figure() 方法建立一個新的圖形或啟用現有圖形。
獲取 projection='3d' 的當前軸。
用 x 和 y 資料點建立一個 3d 輪廓圖。
用 x 和 y 資料點繪製曲面。
要顯示圖形,請使用 show() 方法。
示例
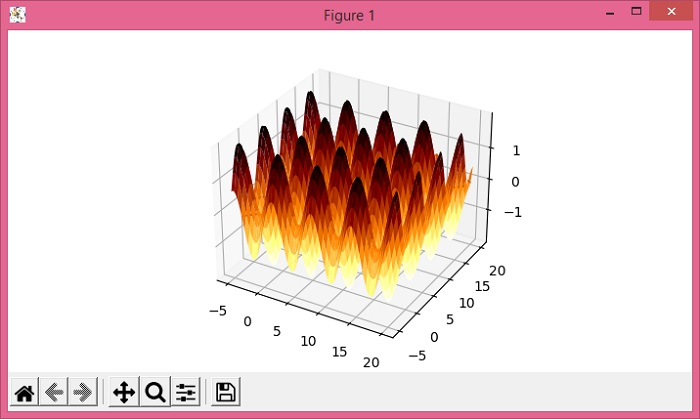
from matplotlib import pyplot as plt
import numpy as np
plt.rcParams["figure.figsize"] = [7.00, 3.50]
plt.rcParams["figure.autolayout"] = True
delta = 0.025
xrange = np.arange(-5.0, 20.0, delta)
yrange = np.arange(-5.0, 20.0, delta)
x, y = np.meshgrid(xrange, yrange)
fig = plt.figure()
ax = fig.gca(projection='3d')
ax.contour(x, y, (np.sin(x) - np.cos(y)), [0])
ax.plot_surface(x, y, (np.sin(x) - np.cos(y)), cmap="afmhot_r")
plt.show()
輸出

更新時間: 15-5-2021
156 次瀏覽

廣告