
 資料結構
資料結構 網路
網路 RDBMS
RDBMS 作業系統
作業系統 Java
Java iOS
iOS HTML
HTML CSS
CSS Android
 Python
 C 程式設計
 C++
C++ C#
C# MongoDB
 MySQL
MySQL JavaScript
 PHP
PHP帶有分類軸的 JavaFX 折線圖示例
內聯圖表,資料值表示一系列由線連線的點。在 JavaFX 中,可以透過例項化 **javafx.scene.chart.LineChart** 類來建立折線圖。
在例項化此類時,你必須傳遞表示 x 和 y 軸的 Axis 類(作為建構函式的引數)的兩個物件。由於 Axis 類是抽象的,因此你需要傳遞它的具體子類的物件:NumberAxis(對於數值)或 CategoryAxis(字串值)。
示例
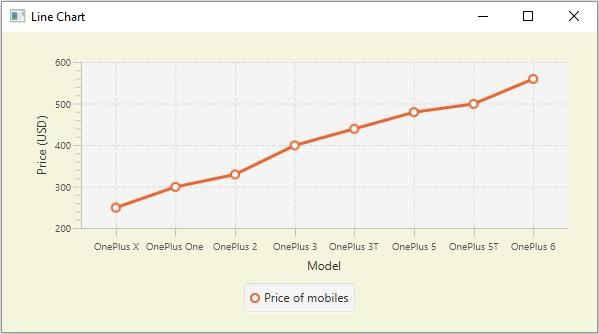
以下是演示如何使用分類軸的示例。在此,我們正在繪製 OnePlus 手機各種型號的銷量,我們使用分類(x)軸來繪製手機型號。
import javafx.application.Application;
import javafx.geometry.Insets;
import javafx.scene.Scene;
import javafx.stage.Stage;
import javafx.scene.chart.CategoryAxis;
import javafx.scene.chart.LineChart;
import javafx.scene.chart.NumberAxis;
import javafx.scene.chart.XYChart;
import javafx.scene.layout.StackPane;
public class LineChart_Category extends Application {
   public void start(Stage stage) {
      //Defining the x an y axes
      CategoryAxis xAxis = new CategoryAxis();
      NumberAxis yAxis = new NumberAxis(200, 600, 100);
      //Setting labels for the axes
      xAxis.setLabel("Model");
      yAxis.setLabel("Price (USD)");
      //Creating a line chart
      LineChart linechart = new LineChart(xAxis, yAxis);
      //Preparing the data points for the line
      XYChart.Series series = new XYChart.Series();
      series.getData().add(new XYChart.Data("OnePlus X", 249));
      series.getData().add(new XYChart.Data("OnePlus One", 299));
      series.getData().add(new XYChart.Data("OnePlus 2", 329));
      series.getData().add(new XYChart.Data("OnePlus 3", 399));
      series.getData().add(new XYChart.Data("OnePlus 3T", 439));
      series.getData().add(new XYChart.Data("OnePlus 5", 479));
      series.getData().add(new XYChart.Data("OnePlus 5T", 499));
      series.getData().add(new XYChart.Data("OnePlus 6", 559));
      //Setting the name to the line (series)
      series.setName("Price of mobiles");
      //Setting the data to Line chart
      linechart.getData().add(series);
      //Creating a stack pane to hold the chart
      StackPane pane = new StackPane(linechart);
      pane.setPadding(new Insets(15, 15, 15, 15));
      pane.setStyle("-fx-background-color: BEIGE");
      //Setting the Scene
      Scene scene = new Scene(pane, 595, 300);
      stage.setTitle("Line Chart");
      stage.setScene(scene);
      stage.show();
   }
   public static void main(String args[]){
      launch(args);
   }
}
輸出

更新於:2020-05-20
917 次瀏覽

廣告