
 資料結構
資料結構 網路
網路 RDBMS
RDBMS 作業系統
作業系統 Java
Java iOS
iOS HTML
HTML CSS
CSS Android
 Python
 C 程式設計
 C++
C++ C#
C# MongoDB
 MySQL
MySQL Javascript
 PHP
PHP可以使用 Matplotlib 繪製隱函式嗎?
Matplotlib 不支援繪製隱函式的功能,但你可以嘗試使用類似我們此處展示的程式碼。
步驟
- 使用 numpy 建立 xrange 和 yrange 資料點。
- 使用 meshgrid() 方法從座標向量中返回座標矩陣。
- 使用 x 和 y 建立一個方程。
- 使用 contour() 方法和 x、y 和方程式建立三維等高線。
- 使用 show() 方法顯示圖形。
示例
from matplotlib import pyplot as plt
import numpy as np
plt.rcParams["figure.figsize"] = [7.50, 3.50]
plt.rcParams["figure.autolayout"] = True
delta = 0.025
xrange = np.arange(-5.0, 20.0, delta)
yrange = np.arange(-5.0, 20.0, delta)
x, y = np.meshgrid(xrange, yrange)
equation = np.sin(x) - np.cos(y)**2
plt.contour(x, y, equation, [0])
plt.show()
輸出
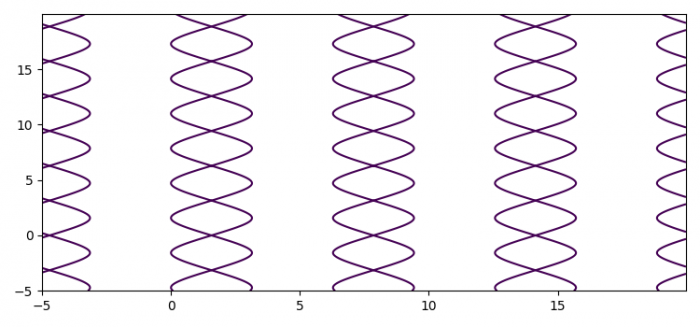
可以使用 scipy.optimize 等工具在 Matplotlib 中繪製隱函式。

更新於:2021 年 5 月 15 日
2K+ 瀏覽

廣告