
 資料結構
資料結構 網路
網路 關係型資料庫管理系統
 作業系統
作業系統 Java
Java iOS
iOS HTML
HTML CSS
CSS Android
 Python
 C 程式設計
 C++
C++ C#
C# MongoDB
 MySQL
MySQL Javascript
 PHP
PHP增大 Matplotlib 中標題和曲線圖之間的距離
為增大 matplotlib 中標題和曲線圖之間的距離,我們可以採取以下步驟 -
使用 numpy 建立 x 點。
使用 numpy sin 建立 y 點。
設定曲線圖的標題。在更改 y 值(在引數中)後,我們可以增大或減小標題和曲線圖之間的距離。
使用 plot() 方法繪製 x 點和 y 點,其中顏色為紅色,線寬為 2。
使用show() 方法顯示圖形。
示例
import numpy as np
from matplotlib import pyplot as plt
plt.rcParams["figure.figsize"] = [7.50, 3.50]
plt.rcParams["figure.autolayout"] = True
x = np.linspace(1, 10, 1000)
y = np.sin(x)
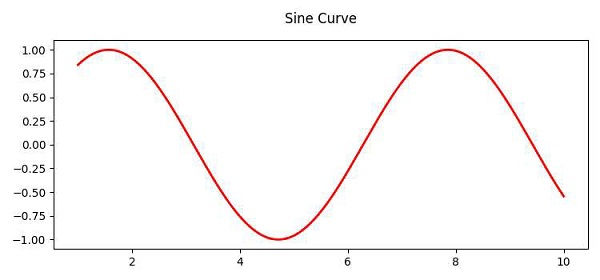
ttl = plt.title('Sine Curve', y=1.05)
plt.plot(x, y, c="red", lw=2)
plt.show()輸出

更新於: 2021 年 4 月 9 日
4K+ 瀏覽

廣告