
 資料結構
資料結構 網路
網路 RDBMS
RDBMS 作業系統
作業系統 Java
Java iOS
iOS HTML
HTML CSS
CSS Android
 Python
 C 程式設計
 C++
C++ C#
C# MongoDB
 MySQL
MySQL Javascript
 PHP
PHP如何設定 matplotlib 表格中一列的背景色?
要設定 matplotlib 表格中一列的背景色,我們可以採取以下步驟 -
設定圖形大小並調整子圖之間的和周圍的填充。
為 columns 屬性建立一個元組。
建立一個 列表,即記錄列表。
建立一個 列表,即每個單元格的顏色。
建立一個圖形和一組子圖。
將表格新增到座標軸 ax。
關閉座標軸。
要顯示圖形,可以使用 show() 方法。
示例
import matplotlib.pyplot as plt
plt.rcParams["figure.figsize"] = [7.50, 3.50]
plt.rcParams["figure.autolayout"] = True
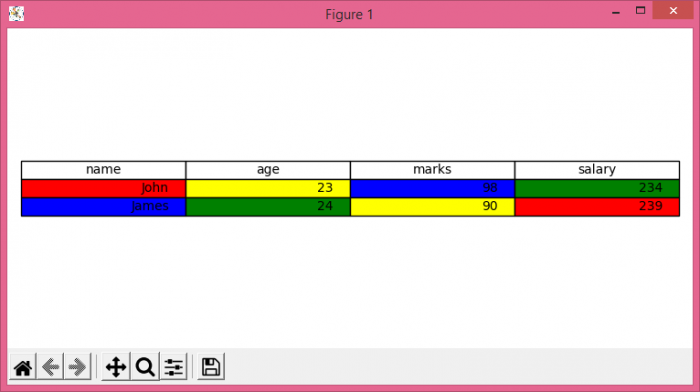
columns = ('name', 'age', 'marks', 'salary')
cell_text = [["John", "23", "98", "234"], ["James", "24", "90", "239"]]
colors = [["red", "yellow", "blue", "green"], ["blue", "green", "yellow", "red"]]
fig, ax = plt.subplots()
the_table = ax.table(cellText=cell_text, cellColours=colors, colLabels=columns, loc='center')
ax.axis('off')
plt.show()輸出

更新於: 2021 年 8 月 10 日
2K+ 瀏覽

廣告