
 資料結構
資料結構 網路
網路 RDBMS
RDBMS 作業系統
作業系統 Java
Java iOS
iOS HTML
HTML CSS
CSS Android
 Python
 C 程式設計
 C++
C++ C#
C# MongoDB
 MySQL
MySQL Javascript
 PHP
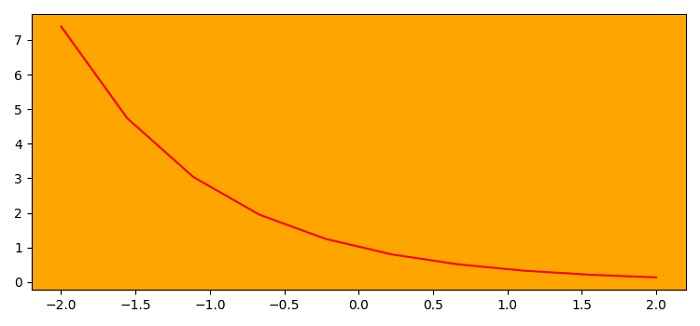
PHP如何在 Matplotlib 中更改軸背景色?
要更改軸背景色,我們可以使用set_facecolor()方法。
步驟
設定圖形大小並調整子圖之間的和周圍的填充。
使用gca()方法獲取當前軸。
設定軸的背景色。
使用 numpy 建立 x 和 y 資料點。
使用plot()方法繪製 x 和 y 資料點。
要顯示該圖形,請使用show()方法。
示例
import numpy as np
import matplotlib.pyplot as plt

plt.rcParams["figure.figsize"] = [7.50, 3.50]
plt.rcParams["figure.autolayout"] = True

ax = plt.gca()
ax.set_facecolor("orange")

x = np.linspace(-2, 2, 10)
y = np.exp(-x)

plt.plot(x, y, color='red')

plt.show()
輸出

更新時間: 03-Jun-2021
4K+ 瀏覽量

廣告