
 資料結構
資料結構 網路
網路 關係型資料庫管理系統
 作業系統
作業系統 Java
Java iOS
iOS HTML
HTML CSS
CSS Android
 Python
 C 程式設計
 C++
C++ C#
C# MongoDB
 MySQL
MySQL Javascript
 PHP
PHP如何從 Matplotlib 圖表中檢索 XY 資料?
要從 matplotlib 圖表中檢索 XY 資料,我們可以使用 get_xdata() 和 get_ydata() 方法。
步驟
使用 numpy 建立 x 和 y 資料點。
使用 xlim() 和 ylim() 方法限制 X 和 Y 軸範圍。
使用 plot() 方法繪製 xs 和 ys 資料點,其中 marker=diamond,color=red 和 markersize=10,將返回的元組儲存在 line 中。
對 line 使用 get_xdata() 和 get_ydata() 方法來獲取 xy 資料。
要顯示圖表,請使用 show() 方法。
示例
import numpy as np
from matplotlib import pyplot as plt
plt.rcParams["figure.figsize"] = [7.00, 3.50]
plt.rcParams["figure.autolayout"] = True
xs = np.random.rand(10)
ys = np.random.rand(10)
plt.xlim(0, 1)
plt.ylim(0, 1)
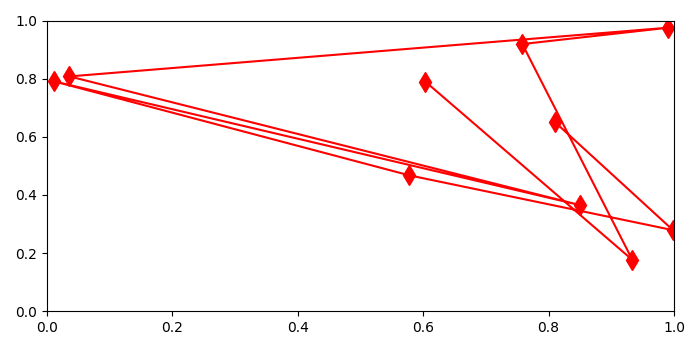
line, = plt.plot(xs, ys, marker='d', c='red', markersize=10)
xdata = line.get_xdata()
ydata = line.get_ydata()
print("X-data of plot is: {}
Y-data for plot is: {}".format(xdata, ydata))
plt.show()輸出
當我們執行程式碼時,它會顯示一個圖表,並在控制檯上列印其 XY 資料。
X-data of plot is: [0.80956382 0.99844606 0.57811592 0.01201992 0.85059459
0.03628843 0.99122502 0.7581602 0.93371784 0.60358098]
Y-data for plot is: [0.65190208 0.27895754 0.46742327 0.79049074 0.36485545
0.80771822 0.9753513 0.91897778 0.17651205 0.7898951 ]

更新日期:2021-05-08
5K+ 瀏覽

廣告