
 資料結構
資料結構 網路
網路 關係資料庫管理系統
 作業系統
作業系統 Java
Java iOS
iOS HTML
HTML CSS
CSS Android
 Python
 C 程式設計
 C++
C++ C#
C# MongoDB
 MySQL
MySQL Javascript
 PHP
PHP如何在 Matplotlib 中使用 cycler 屬性繪製多色迴圈圖
Matplotlib 為所有圖形和繪圖提供了一個預設的顏色迴圈,但是,為了繪製具有多個顏色迴圈的繪圖,我們可以使用 Matplotlib 的 **cycler** **屬性**。它用於為軸繪製重複的模式。
首先,我們將使用面向物件的 API(例如 **pyplot**)來繪製特定的視覺化效果。
from cycler import cycler
import numpy as np
from matplotlib.backends.backend_agg import FigureCanvasAgg as FigureCanvas
from matplotlib.figure import Figure
from IPython.core.display import display
在此示例中,我們將建立兩個物件,它們將在每四個物件後重復迴圈。因此,在建立兩個物件後,最後兩個將是前兩個物件的重複。
fig = Figure()
FigureCanvas(fig)
設定軸的 facecolor、alpha 和 edgecolor,
fig.set(facecolor='grey', alpha=0.2, edgecolor='m')
ax = fig.add_subplot(111)
設定繪製圖形的資料,
x = np.array([0.4, 0.8, 1.2, 1.6, 2.0])
y = [1, 6, 6, 1, 0]
現在為顏色和陰影屬性定義自定義迴圈器,並將其設定為軸,
custom_cycler = cycler('color', ['g', 'blue', 'y', 'c']) + \
cycler('hatch', ['+*', 'xx', '+x', '+O.'])
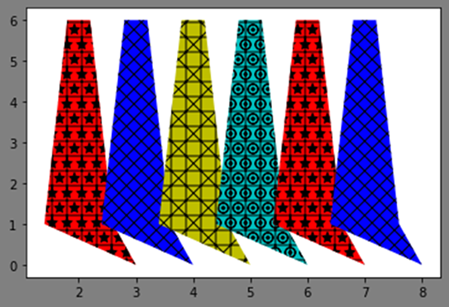
ax.set_prop_cycle(custom_cycler)繪製六個物件的圖形,
ax.fill(x+1, y)
ax.fill(x+2, y)
ax.fill(x+3, y)
ax.fill(x+4, y)
ax.fill(x+5, y)
ax.fill(x+6, y)
顯示繪圖,
display(fig)
輸出

更新於: 2021年2月23日
690 次瀏覽

廣告